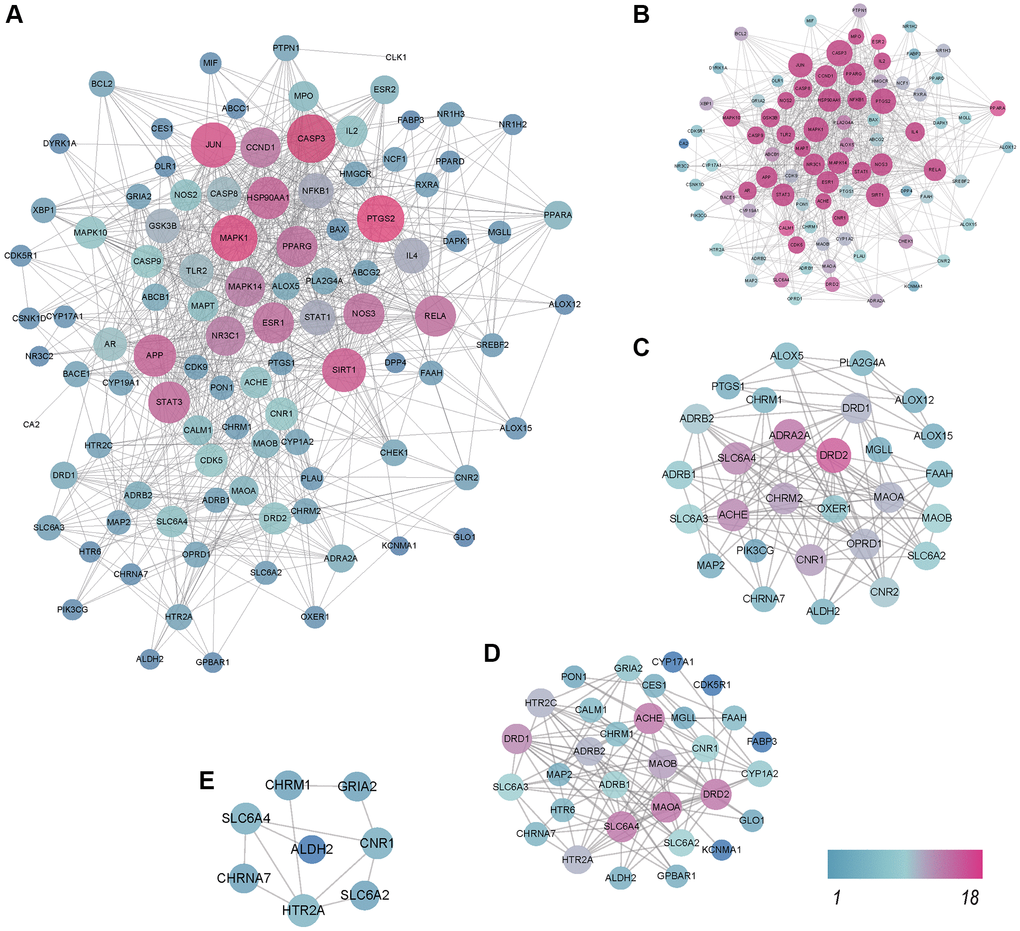
Figure 3.Protein-protein interaction (PPI) network analysis. The higher the degree of interaction is, the larger the nodes, and the color changes gradually from blue to red. (A) PPI network of 203 proteins and 1876 interaction relationships. (B) PPI network of Cluster 1. (C) PPI network of Cluster 2. (D) PPI network of Cluster 3. (E) PPI network of Cluster 4.