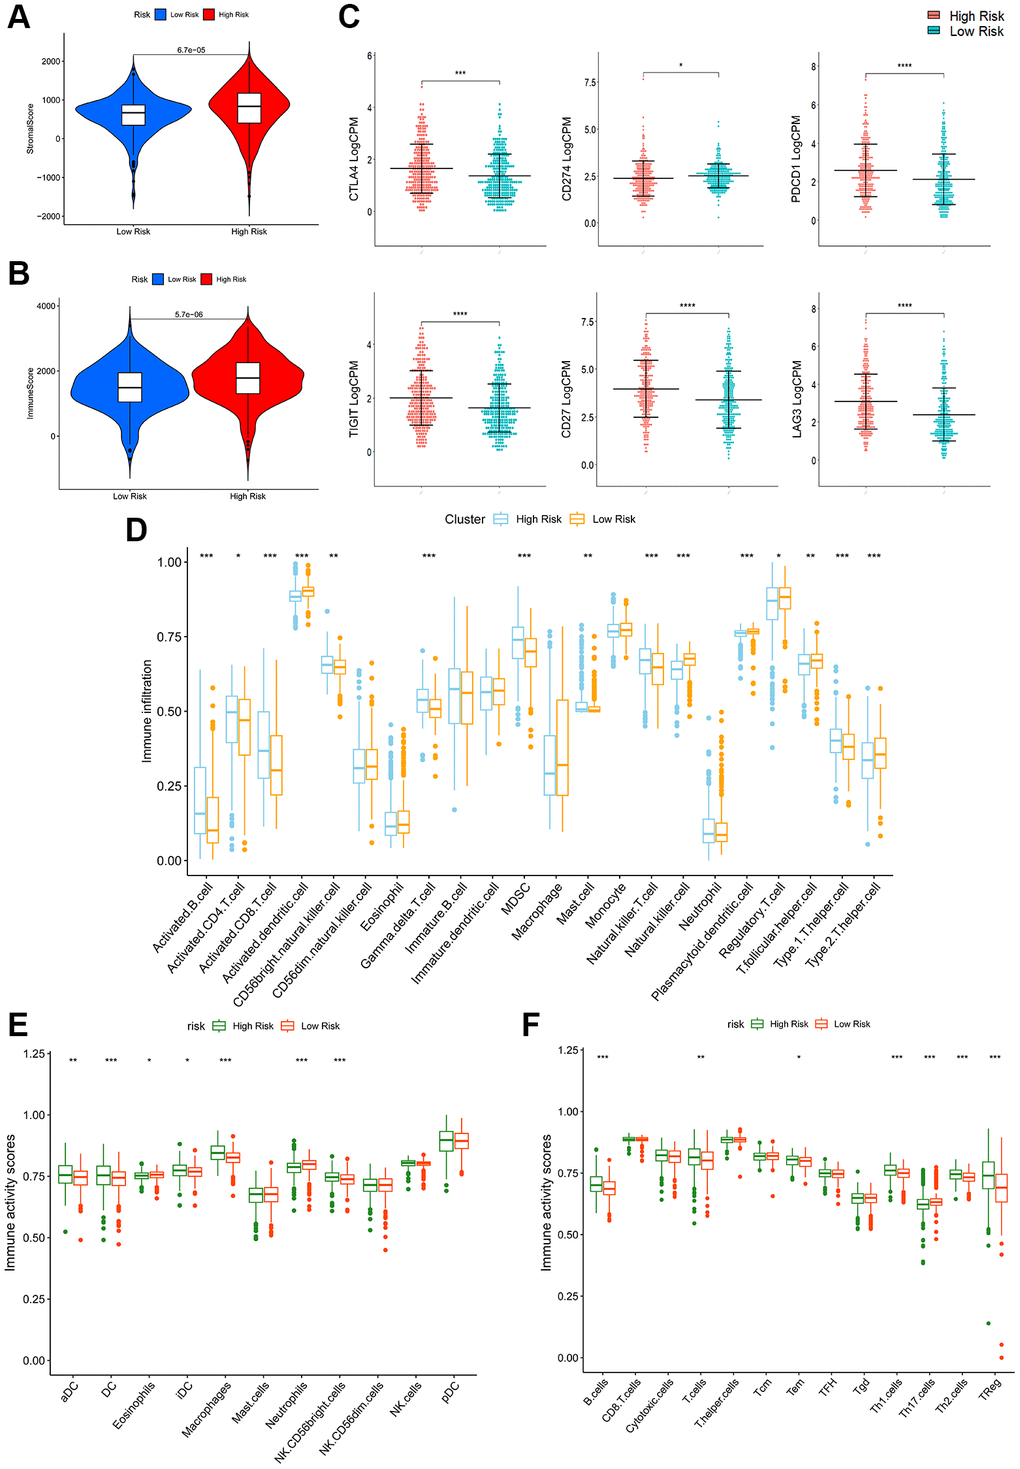
Figure 6.Immune-related analyses in high- and low-PRPCDGs-risk groups in TCGA-KIRC cohort. The stromal scores (A), immune scores (B), immune checkpoints’ expression (C), immune infiltration (D), immune activity scores of innate (E) and adaptive (F) immune cells in these two groups.