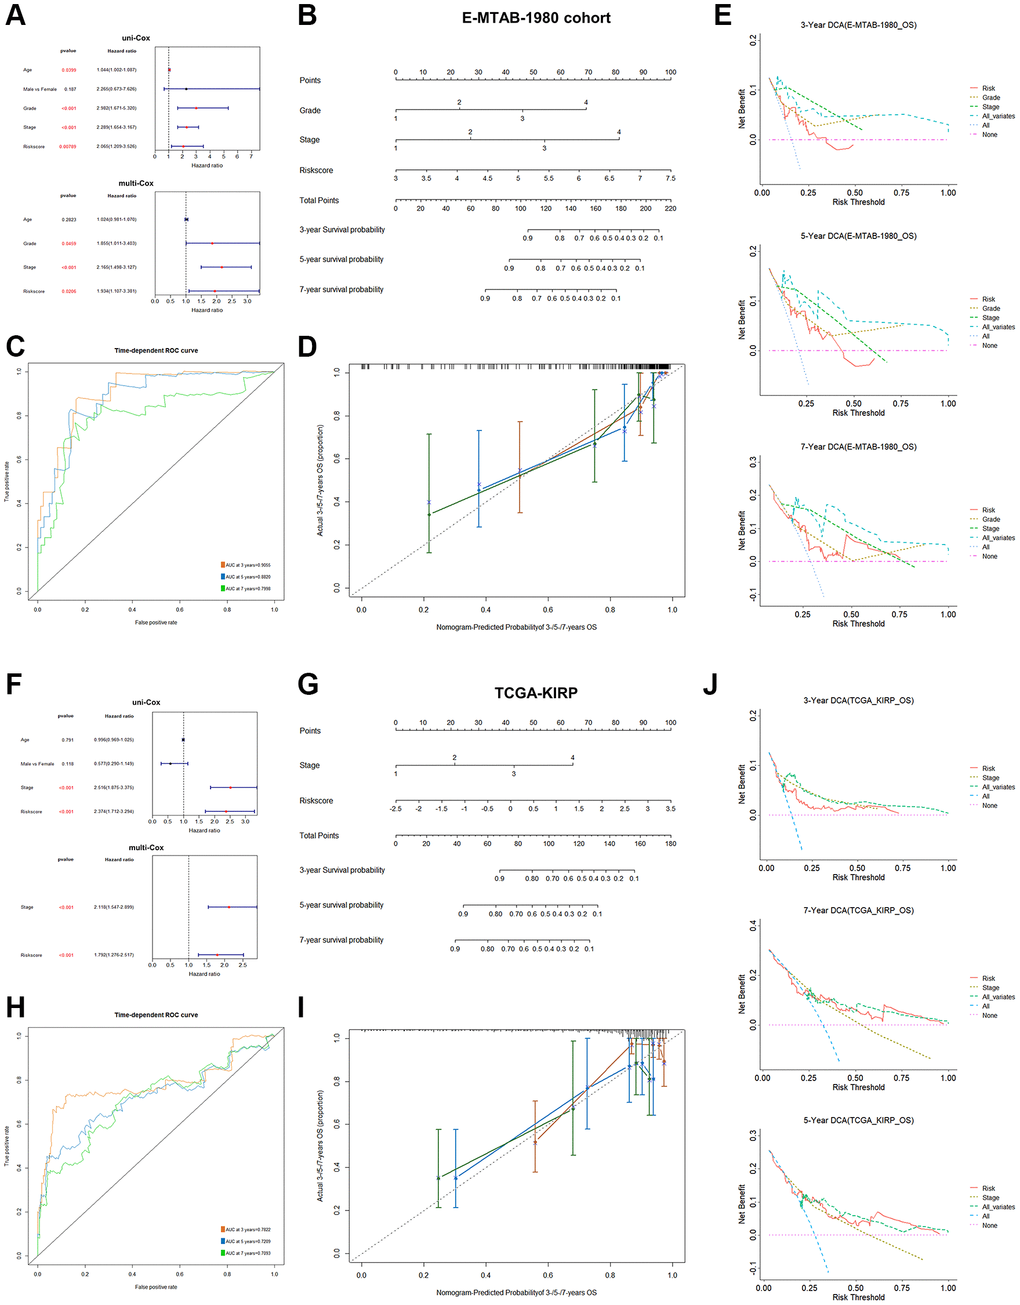
Figure 5.Clinical model construction based on PRPCDGs risk signature in E-MTAB-1980 and TCGA-KIRP datasets. (A–E) Uni- and multi-Cox regression analyses based on the OS; a nomogram model on patients’ 3-/5-/7-year survival probability; ROC curves presenting model’s predictive accuracy; calibration curves and DCA curves over 3-/5-/7-year OS probability in E-MTAB-1980 dataset. (F–J) The same analyses in KIRP dataset.