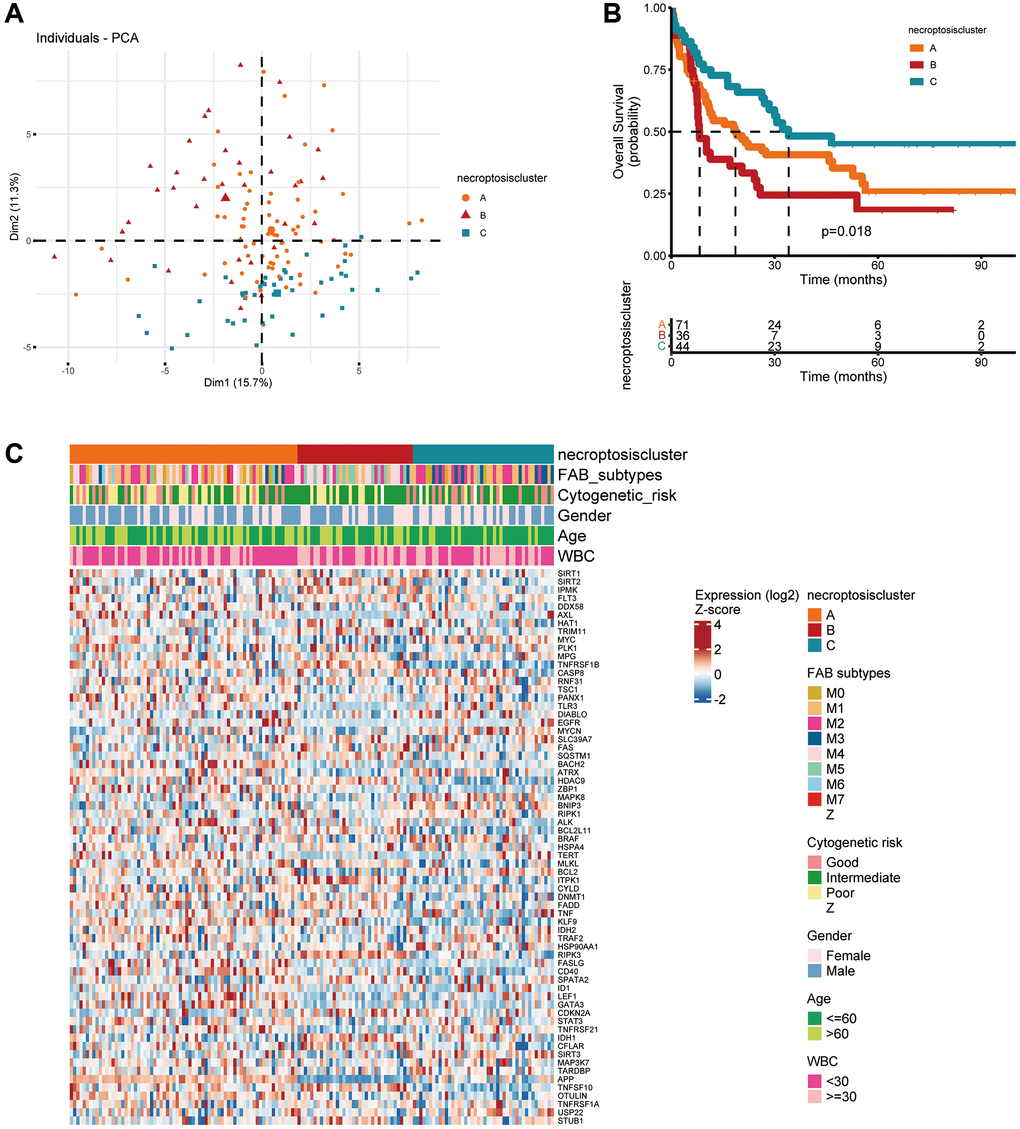
Figure 2.Subtypes of necroptosis-related genes and their clinicopathological and biological characteristics in AML. (A) PCA of transcriptomes among the three identified clusters. (B) Kaplan–Meier curves showing overall survival for the three necroptosis clusters. (C) Clinicopathological characteristics and expression of necroptosis-related genes among the three necroptosis clusters.