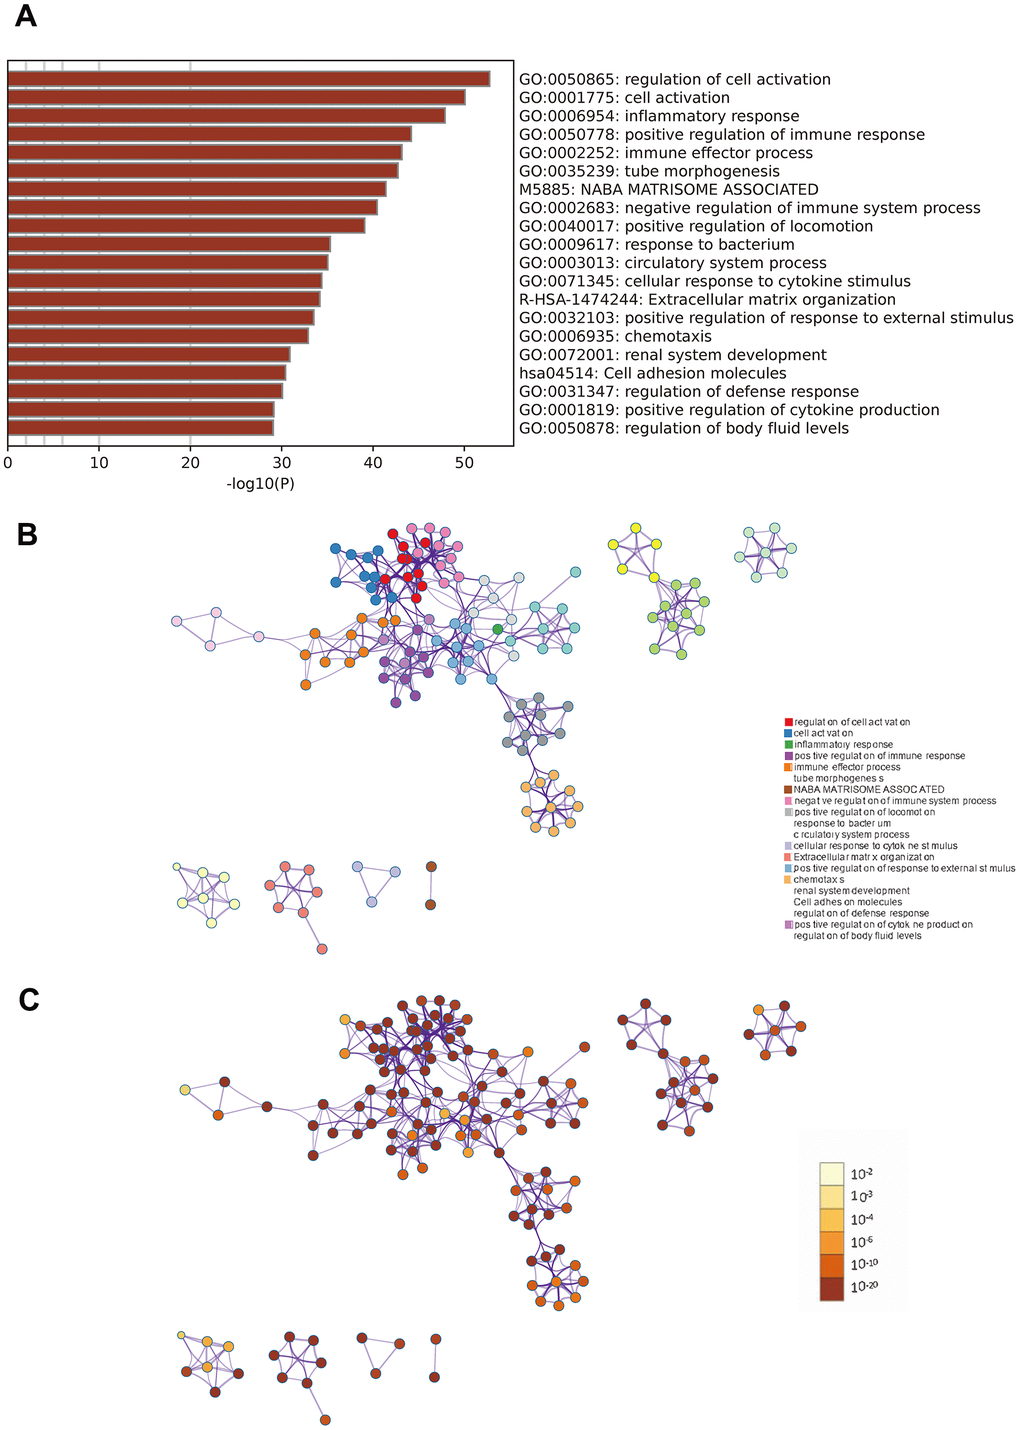
Figure 3.Metascape enrichment analysis. (A) Heatmap of enriched terms across input differently expressed gene lists, colored by p-values. (B) Network of enriched terms colored by cluster identity. (C) Network of enriched terms colored by p-value.
Figure 3 — SEL1L3 as a link molecular between renal cell carcinoma and atherosclerosis based on bioinformatics analysis and experimental verification | Aging