Submit an Article
Navigate
Home
Editorial Board
Editorial Policies
Current Volume
Archive
Scientific Integrity
Publication Ethics Statements
Interviews with Outstanding Authors
Newsroom
Sponsored Conferences
Podcast
Contact
Special Collections
Submit an Article
Online ISSN: 1945-4589
Research Paper
|
Volume 15, Issue 22
|
pp. 13134–13149
Prevalence and risk factors of bone metastasis and the development of bone metastatic prognostic classification system: a pan-cancer population study
Back to article
Figure 7
(7 of 7)
−
100%
+
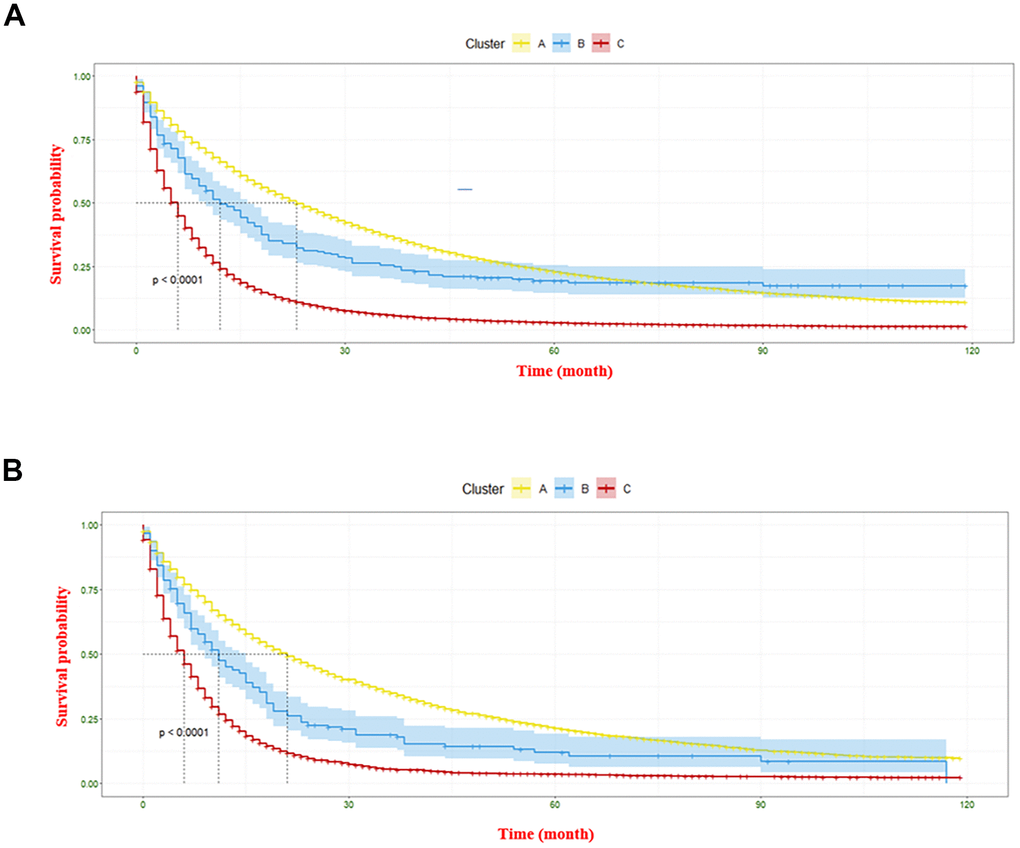
Figure 7.
The Kaplan-Meier curve displaying survival differences of three clusters.
(
A
) denotes the information gathered from the construction cohort, and (
B
) represents the information regarding the validation cohort.