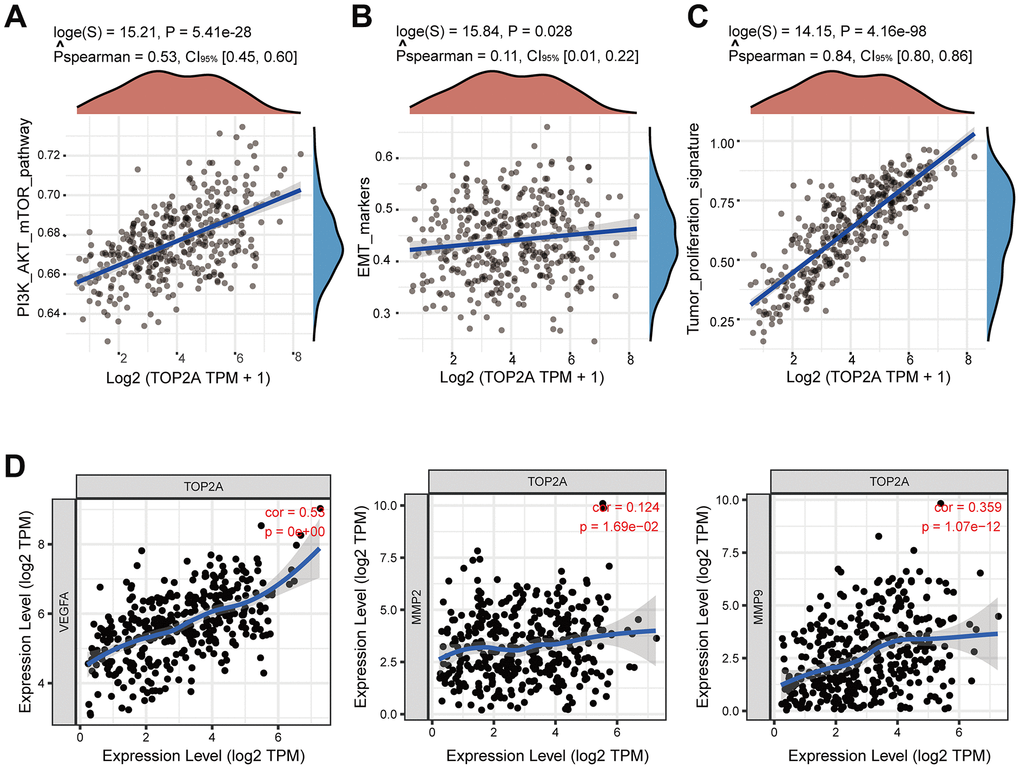
Figure 6.Correlation analysis between TOP2A expression and pathways and markers related to metastasis or proliferation using TCGA database. (A–C) Spearman correlation analysis between TOP2A and PI3K-AKT-mTOR pathway, EMT markers, and tumor proliferation signature. (D) Spearman correlation analysis between the expression level of TOP2A and VEGFA, MMP2, and MMP9.