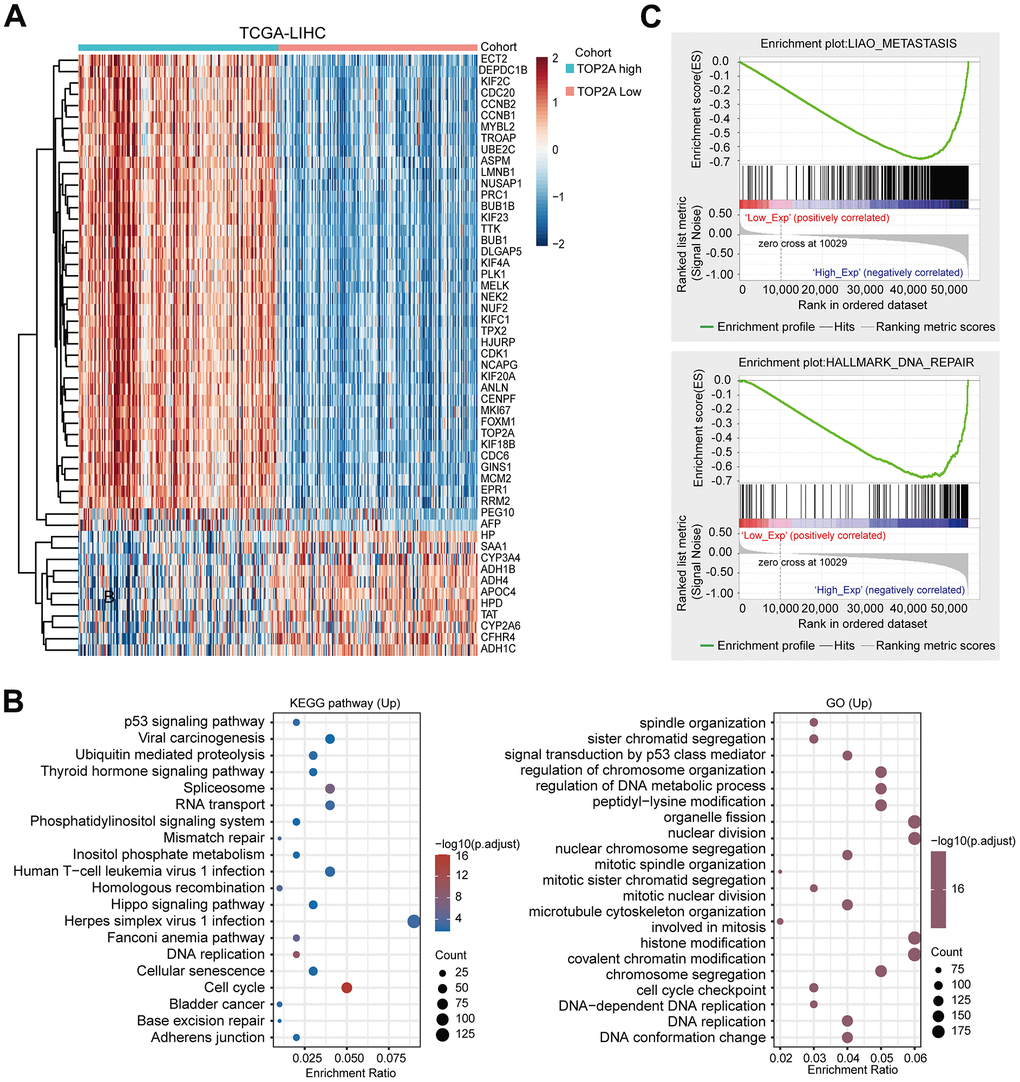
Figure 5.Functional enrichment analysis of TOP2A in LIHC. (A) Heatmap of TOP2A co-expressed genes in LIHC using TCGA database. (B) KEGG and GO enrichment analysis for the up-regulated genes in LIHC. (C) Gene Set Enrichment Analysis (GSEA) for TOP2A in LIHC.