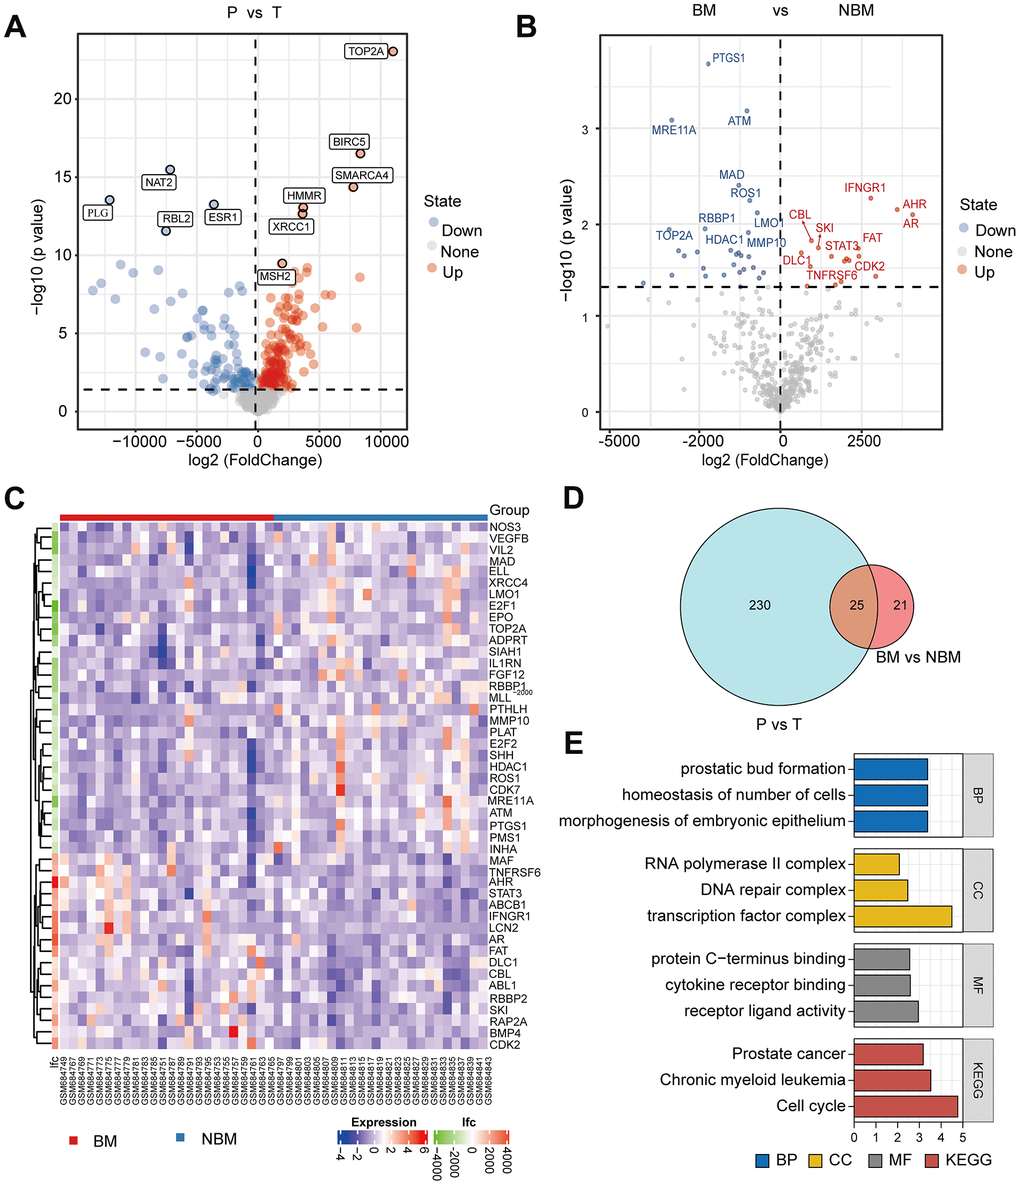
Figure 1.TOP2A is associated with bone metastasis of liver hepatocellular carcinoma. (A) Volcano plot of differentially expressed genes (DEGs) between LIHC and paracancerous tissues from GSE27635 database, red indicated up-regulated genes, and blue indicated down-regulated genes. (B) Volcano plot of DEGs between LIHC with BM and NBM. (C) Heatmap of DEGs between LIHC with and without BM. (D) Venn diagram of DEGs from A and B. (E) GO and KEGG enrichment analysis of the above overlapping genes. P, peritumor; T, tumor; BM, bone metastasis; NBM, non-bone metastasis.