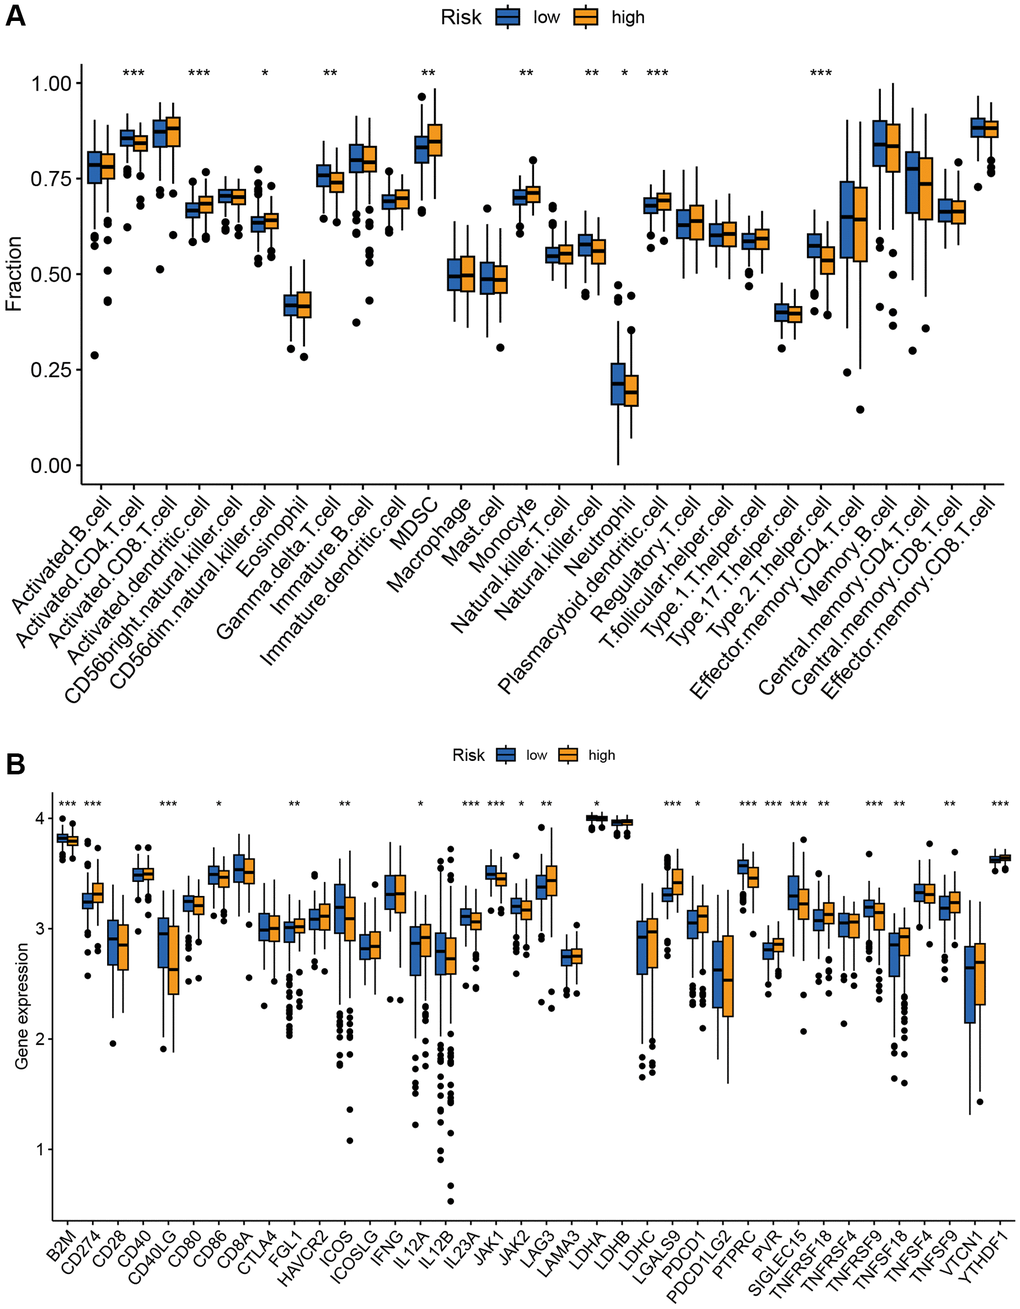
Figure 7.Correlation analysis of TRGs risk score with immune landscape. (A) The proportion of 28 immune cells between low-risk and high-risk groups (*p < 0.05; **p < 0.01; and ***p < 0.001). (B) The distribution of 38 immune checkpoints between the high-risk and low-risk groups (*p < 0.05; **p < 0.01; and ***p < 0.001).