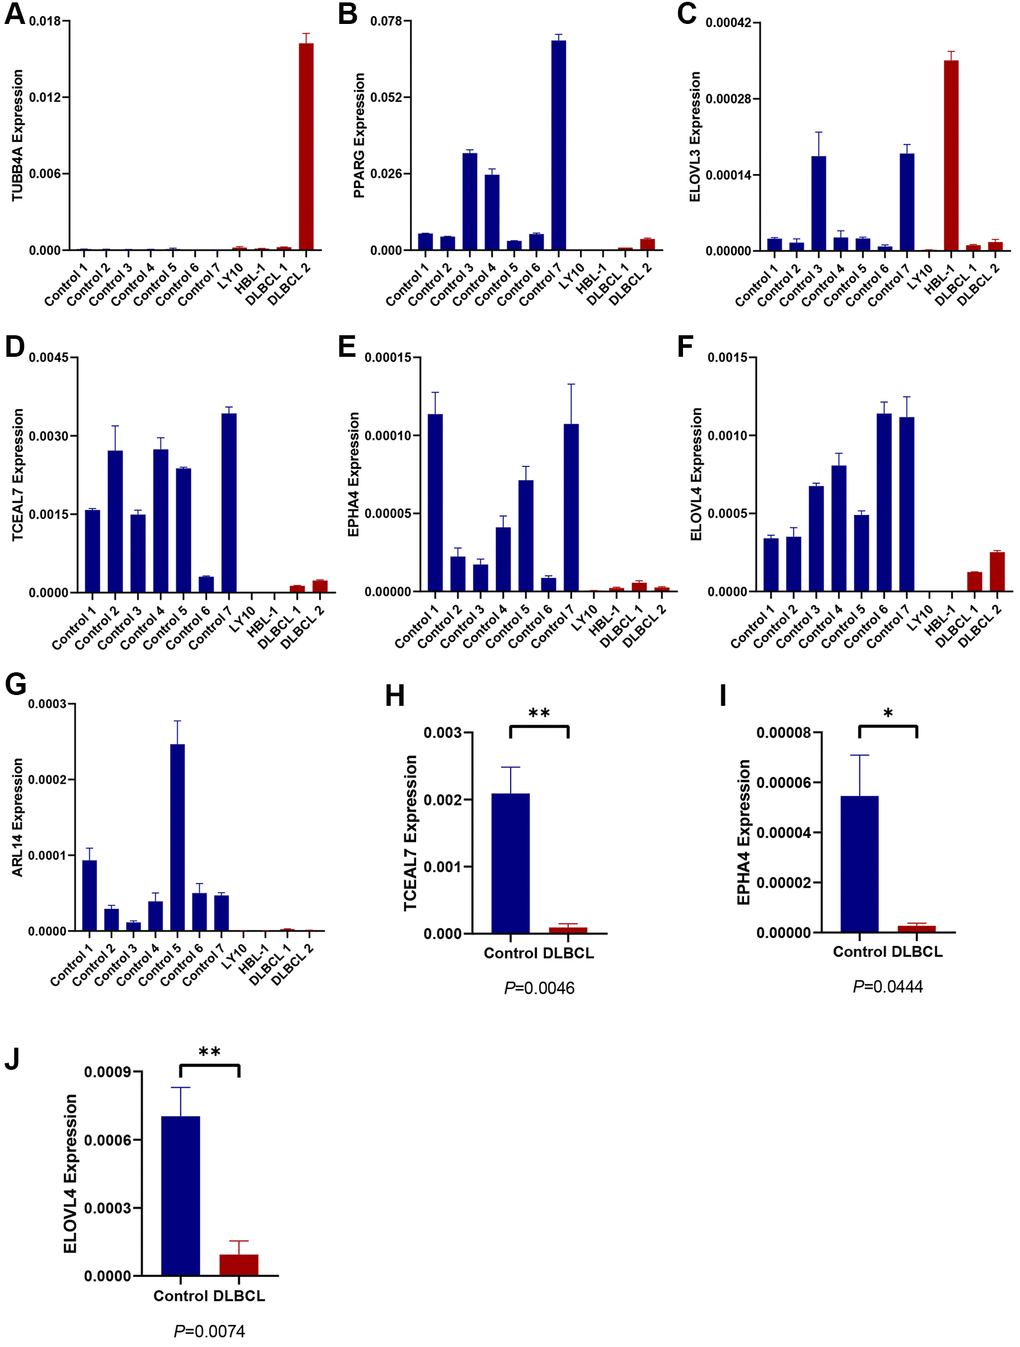
Figure 4.Expression evaluation of candidate TRGs in the model. (A–G) The expression level of 7 TRGs in two DLBCL cell lines (HBL-1 and OCI-LY10), two DLBCL-invaded lymph node samples (DLBCL 1 and DLBCL 2) and seven normal lymph node samples (control 1–7), respectively. (H, I) The expression of (H) TCEAL7, (I) EPHA4, and (J) ELOVL4 in DLBCL group and control group.