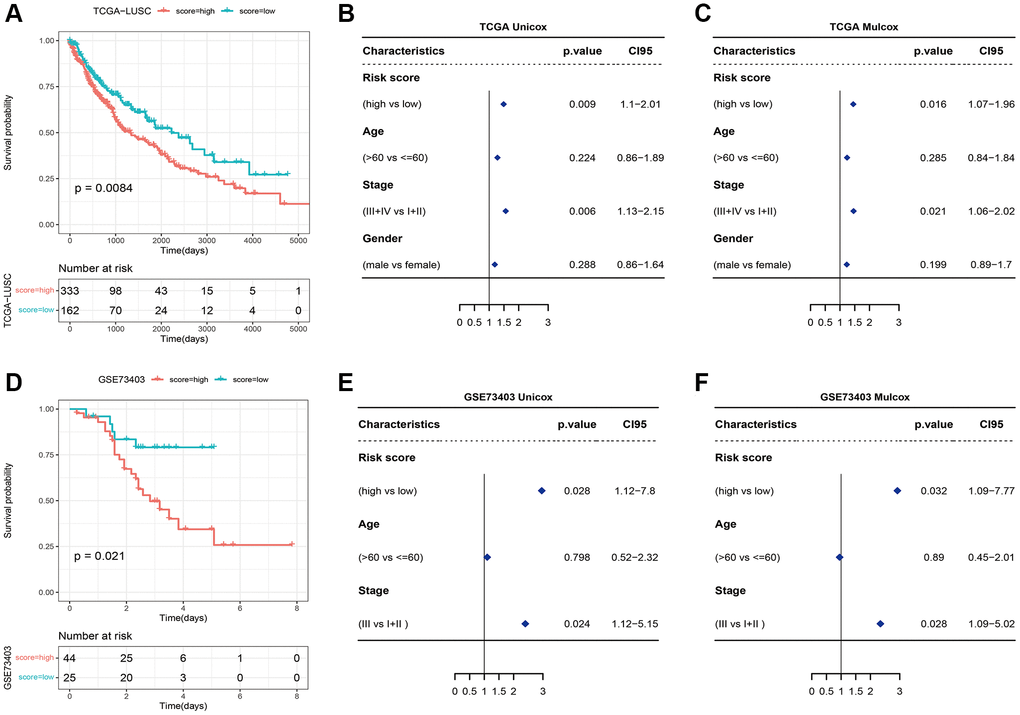
Figure 6.(A) Survival curves of high-risk and low-risk groups based on the necroptosis signature. (B) Univariate and (C) multivariate analyses of the necroptosis signature. (D) Survival curve of high-risk and low-risk groups in the GSE73403 dataset. (E) Univariate and (F) multivariate Cox analyses of the necroptosis signature in the GSE73403 dataset.