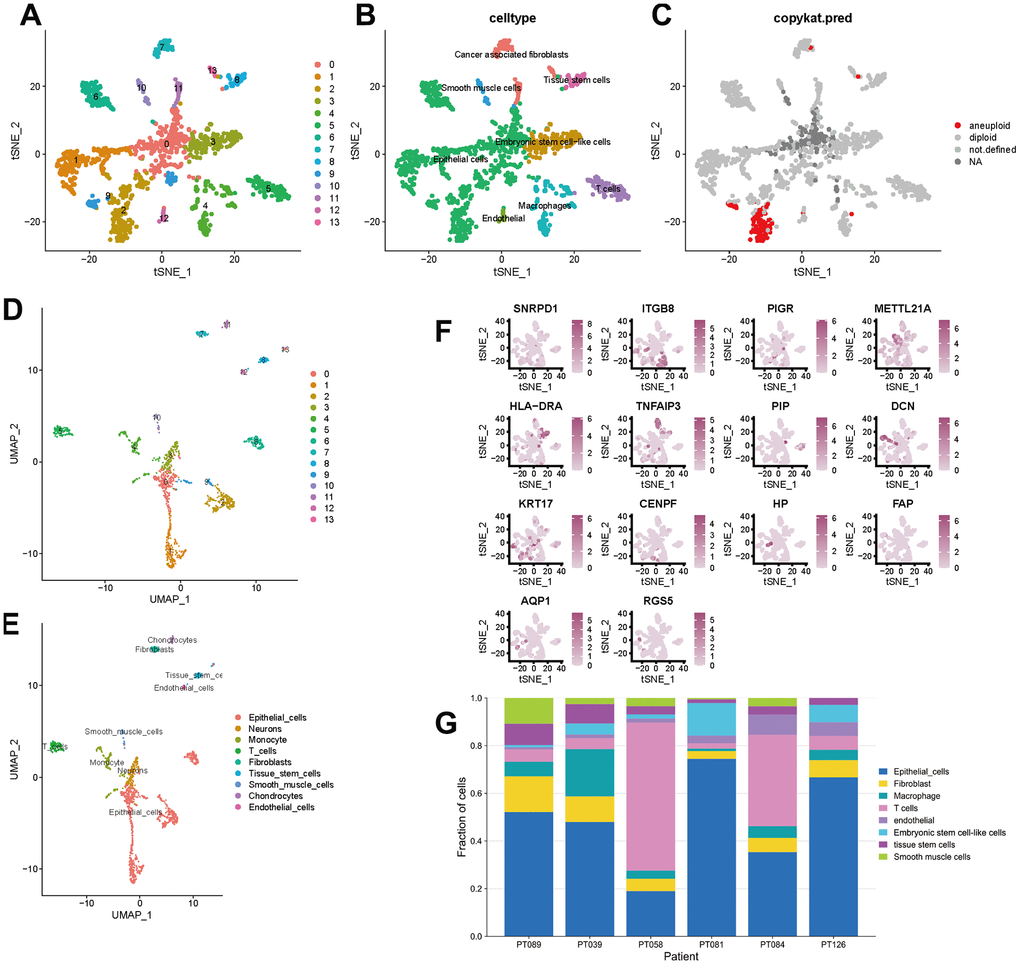
Figure 3.t-SNE and UMAP clustering of TNBC samples. (A–C) Clusters, cell type annotations and aneuploid cells at the single-cell level in TNBC samples by t-SNE method. (D, E) Clusters and cell type annotations at the single-cell level in TNBC samples by UMAP method. (F) Scatter plot of marker gene expression in each cluster. (G) Inter-tumor heterogeneity of triple-negative breast cancer at the single-cell level.