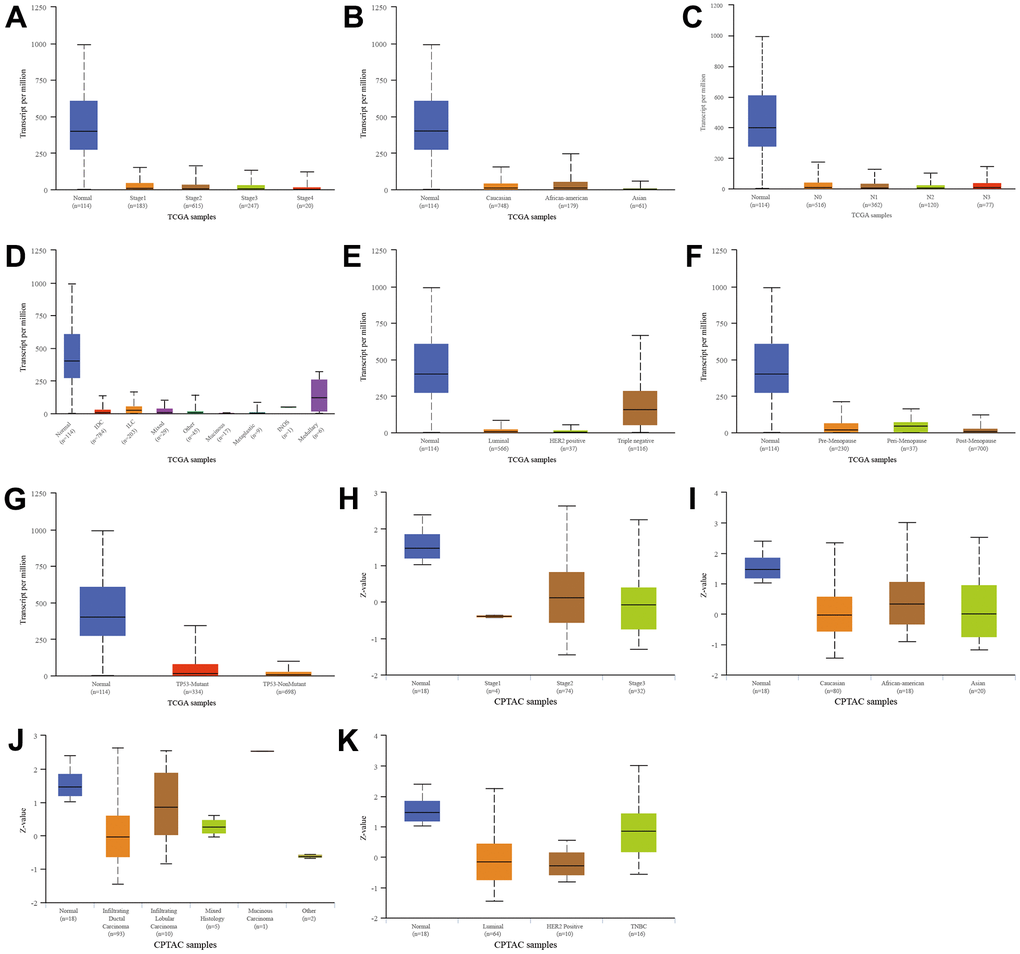
Figure 7.Relationship between SFRP1 and different clinical indicators. (A) Individual cancer stages in TCGA. (B) Race in TCGA. (C) Nodal metastasis status in TCGA. (D) Tumor histology in TCGA. (E) Major subclasses in TCGA. (F) Menopause status in TCGA. (G) TP53 mutation status in TCGA. (H) Individual cancer stages in CPTAC. (I) Race in CPTAC. (J) Tumor histology in CPTAC. (K) Major subclasses in CPTAC.