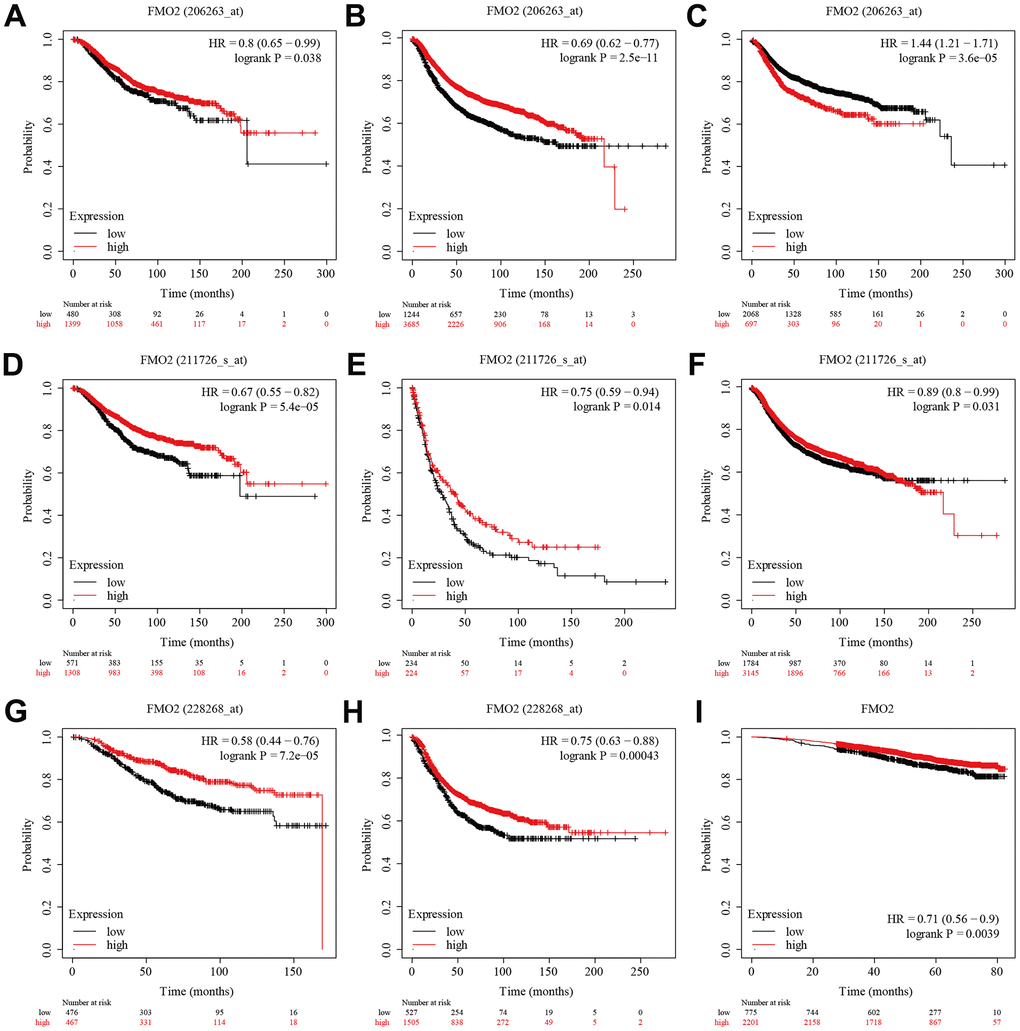
Figure 3.The survival analysis of FMO2 in the gene chip data and RNA-sequence data of Kaplan–Meier plotter. (A) FMO2 (206263_at) in OS. (B) FMO2 (206263_at) in RFS. (C) FMO2 (206263_at) in DMFS. (D) FMO2 (211726_s_at) in OS. (E) FMO2 (211726_s_at) in PPS. (F) FMO2 (211726_s_at) in PPS. (G) FMO2 (228268_at) in OS. (H) FMO2 (228268_at) in RFS. (I) FMO2 in OS.