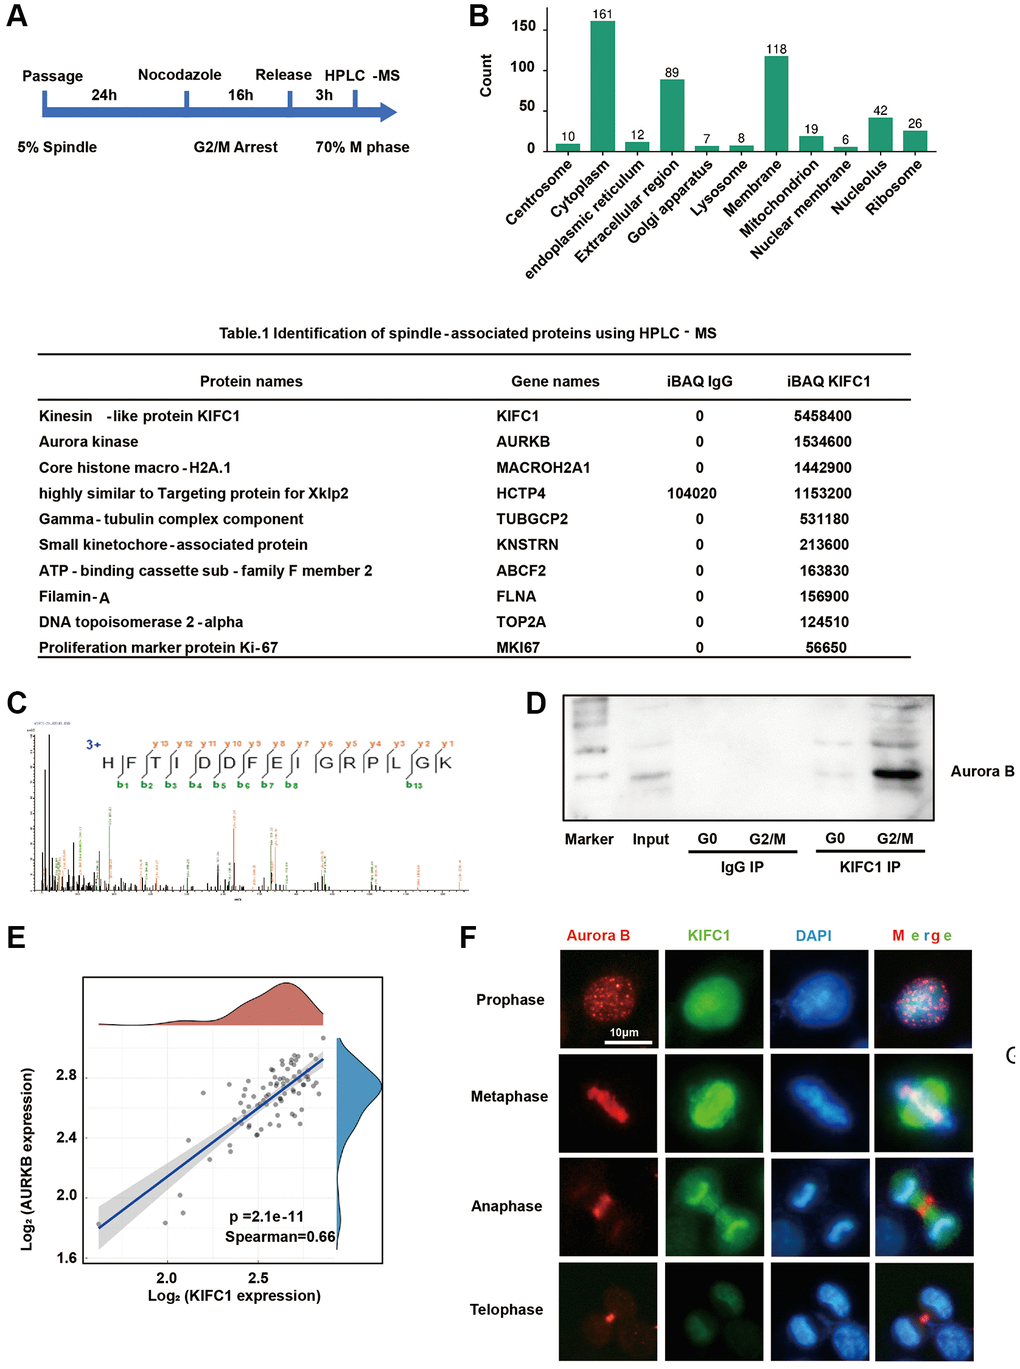
Figure 5.Proteomic analysis reveals protein interactions with KIFC1. (A) Flow chart of metaphase cell; (B) GO cluster of identification results, clustering according to organelles; (C) Mass spectrum peak of Aurora B; (D) Immunoprecipitation with anti KIFC1 antibody and detect Aurora B content through western blot; (E) Bioinformatics analysis of the correlation between KIFC1 and Aurora B mRNA expression; (F) immunofluorescence stain of KIFC1 (green) and Aurora B (red), DNA were stained with DAPI (blue).