Submit an Article
Navigate
Home
Editorial Board
Editorial Policies
Current Volume
Archive
Scientific Integrity
Publication Ethics Statements
Interviews with Outstanding Authors
Newsroom
Sponsored Conferences
Podcast
Contact
Special Collections
Submit an Article
Online ISSN: 1945-4589
Research Paper
|
Volume 15, Issue 21
|
pp. 12537–12550
Cyclosporin A-mediated translocation of HuR improves MTX-induced cognitive impairment in a mouse model via NCOA4-mediated ferritinophagy
Back to article
Figure 4
(4 of 6)
−
100%
+
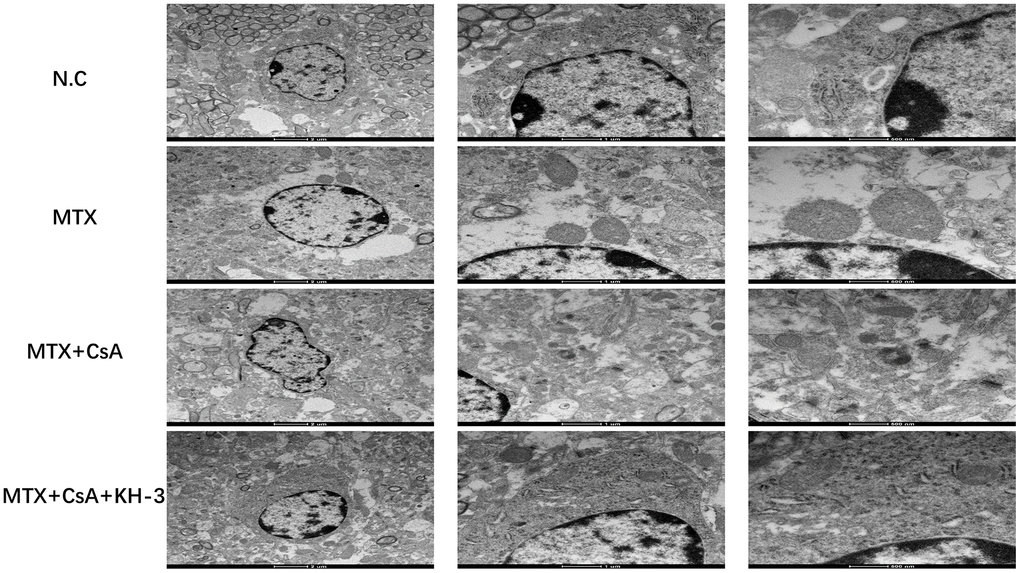
Figure 4.
Ultrastructural mitochondrial changes in the hippocampus in different groups.
Transmission electron microscopy images of hippocampal neuronal mitochondria from each group (scale bar = 2 um, 1 um and 500 nm from left to right, respectively).