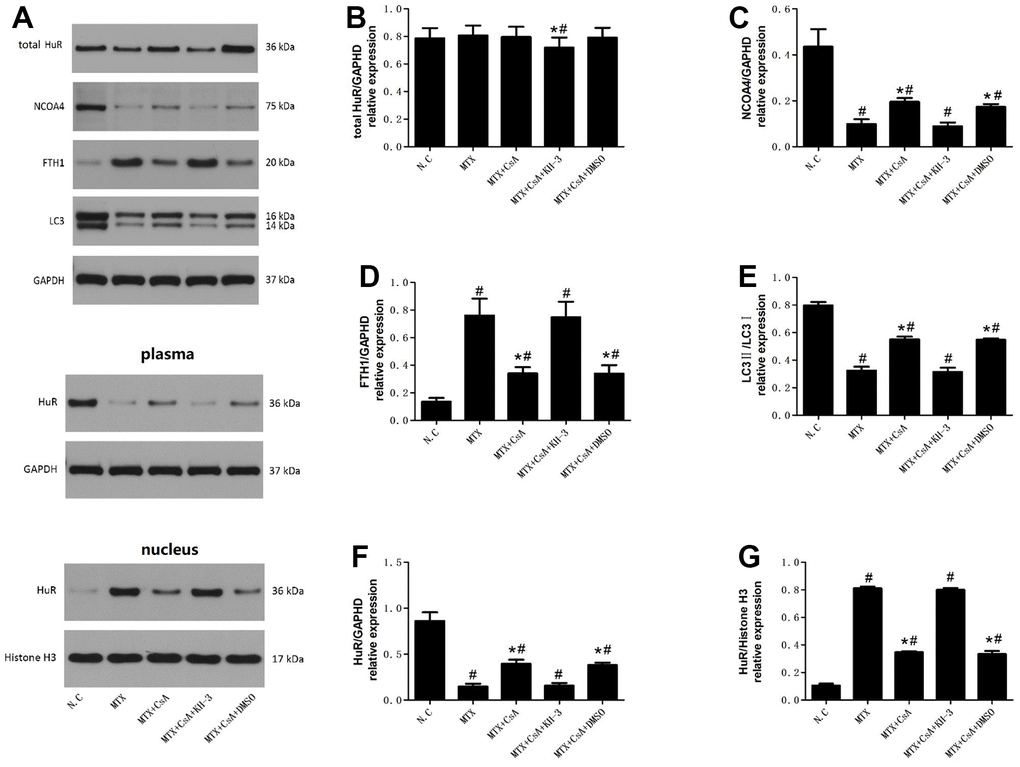
Figure 2.Effects of CsA on the expression of HuR and ferritinophagy-related proteins in hippocampus. (A) Representative blots of the total HuR, NCOA4, FTH1, LC3II/LC3I, HuR in the cytoplasm and of HuR in the nucleus in five groups of mice hippocampi. (B–G) Statistical results of the total HuR, NCOA4, FTH1, LC3II/LC3I, HuR in the cytoplasm and of HuR in the nucleus in five groups of mice hippocampi. The data present the means ± standard error of the mean. (n=3 per group). #p <0.05 versus the control group; *p<0.05 versus the MTX group.