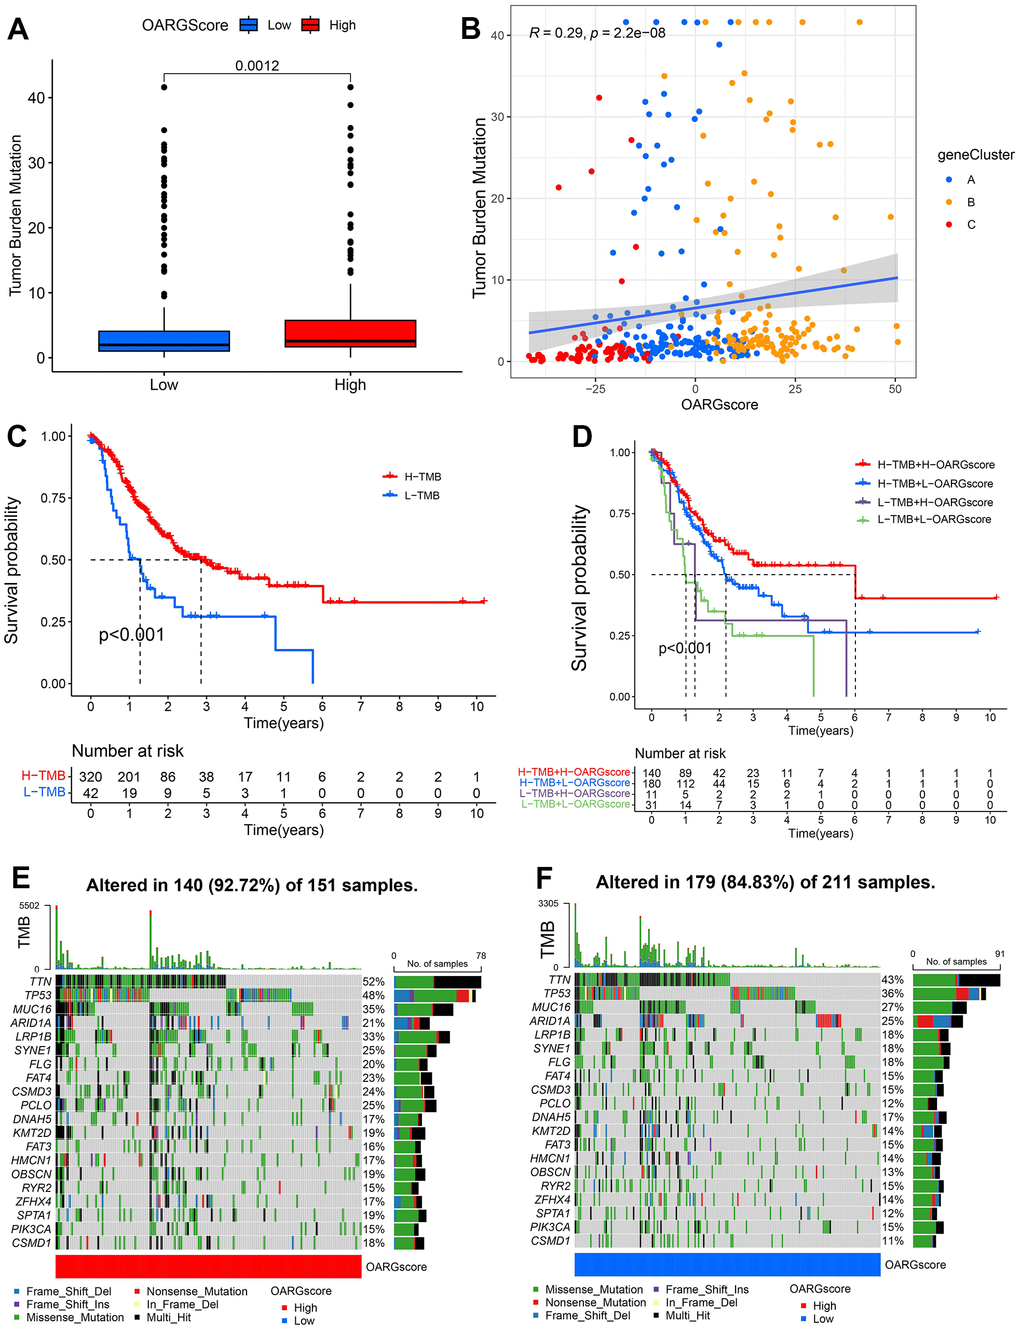
Figure 7.Characteristics of OARG modification in cancer somatic mutation. (A) The differences in the TMB between low- and high-OARGscore groups. (B) The relationship between the TMB and OARGscore. (C) Survival analysis utilizing KM curves for low- and high-TMB groups. (D) KM curves for patients stratified by both TMB and OARGscore. (E, F) Waterfall plot of cancer somatic mutations constructed from patients with (E) high-OARGscore and (F) low-OARGscore.