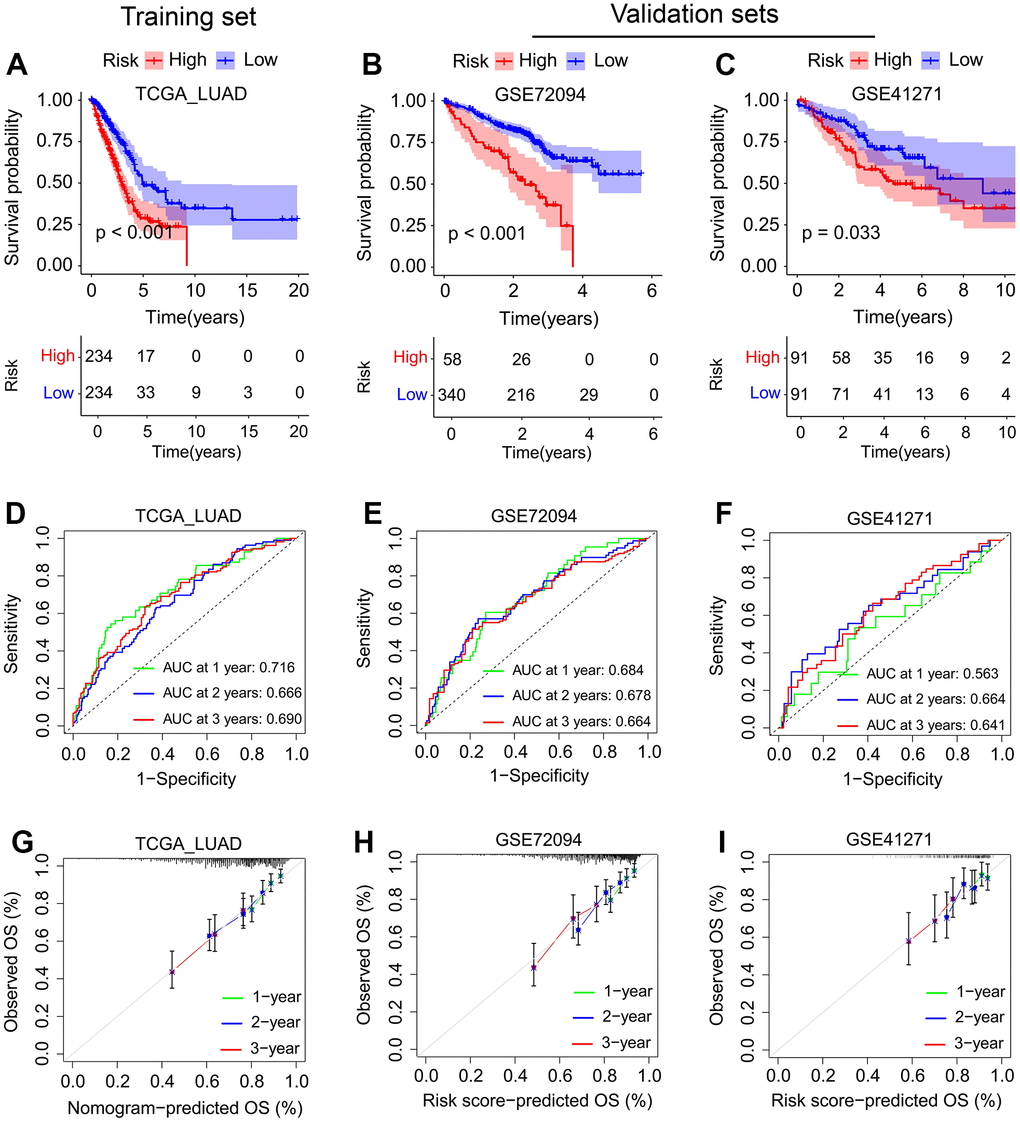
Figure 5.Evaluation of the SFTPC-related risk score in LUAD. (A–C) Kaplan-Meier curves of the OS of LUAD patients in the TCGA_LUAD (A), GSE72094 (B), and GSE41271 (C) cohorts. (D–F) Time-dependent ROC analyses of risk score regarding the patients’ 1-, 2-, and 3-years survival status in the TCGA_LUAD (D), GSE72094 (E), and GSE41271 (F) cohorts. (G–I) Calibration curves of SFTPC-related risk score between predicted and observed 1-, 2-, and 3-years survival status in the TCGA_LUAD (G), GSE72094 (H), and GSE41271 (I) cohorts.