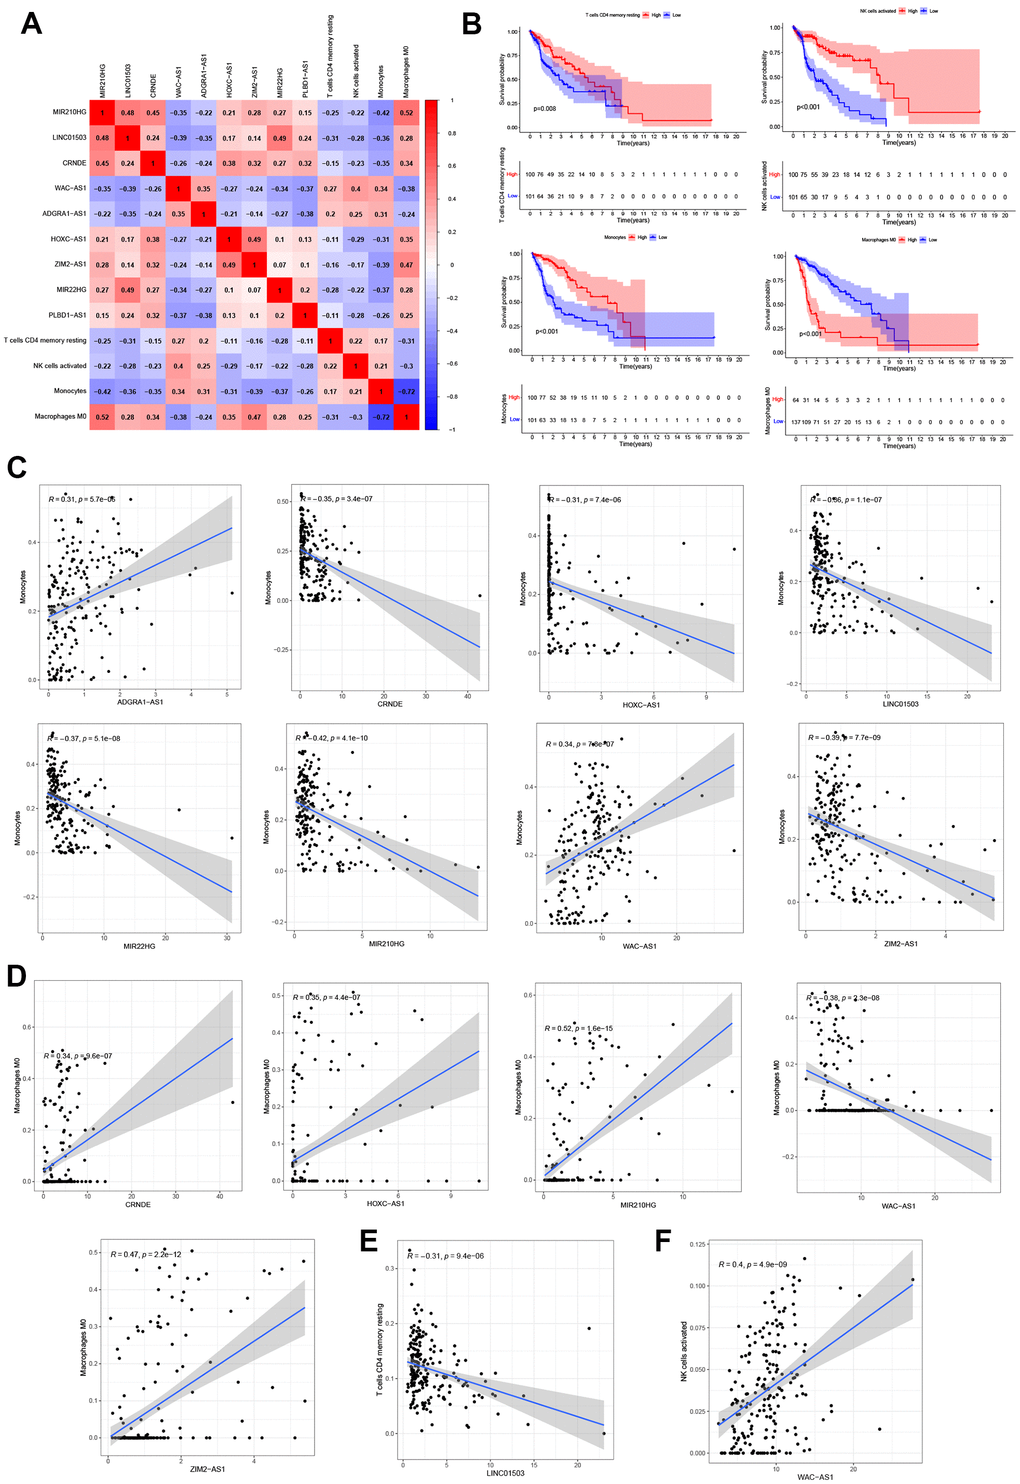
Figure 8.Correlation analysis of 9 NRLs and immunity. (A) Heatmap of 9 NRLs and 4 immune cells (T cells CD4 memory resting, NK cells activated, Monocytes and Macrophages M0). (B) Kaplan-Meier survival analysis. (C–F) The relationship between 9 NRLs and 4 infiltrations of immune cells.