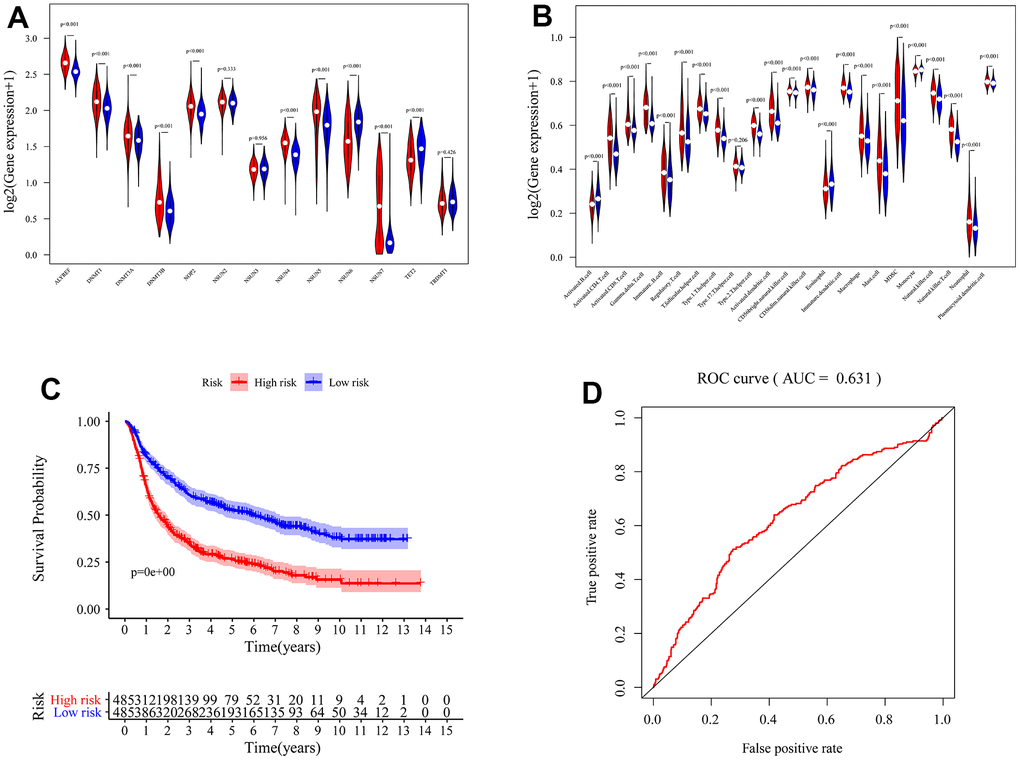
Figure 7.Validation of m5c-related signature. The differences of immune infiltration cells (A) and m5c expression level (B) between high and low risk groups. (C) K-M survival curves for the glioma patients of risk groups in the CGGA dataset. (D) The area under the curve (AUC) of ROC curves was 0.631 in predicting survival events from the CGGA dataset.