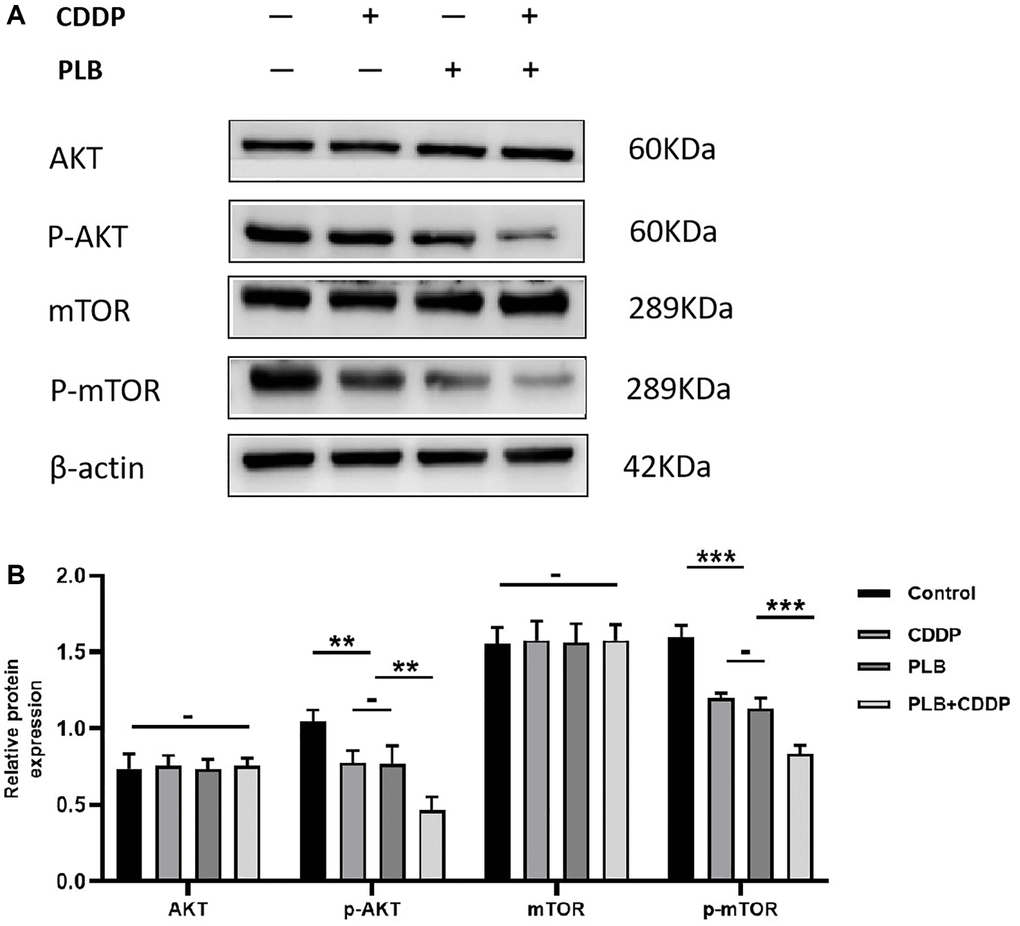
Figure 6.Administration of plumbagin affected Akt/mTOR expression in TSCC PDX models. (A) The expression level of AKT, p-AKT, mTOR and p-mTOR were measured by Western blotting. (B) The histograms indicate the relative expression levels of p-AKT/AKT, p-mTOR/mTOR. The quantitative data are shown as the mean ± SD of 3 independent experiments. ***P < 0.001, **P < 0.01 and −, no statistical difference.