Submit an Article
Navigate
Home
Editorial Board
Editorial Policies
Current Volume
Archive
Scientific Integrity
Publication Ethics Statements
Interviews with Outstanding Authors
Newsroom
Sponsored Conferences
Podcast
Contact
Special Collections
Submit an Article
Online ISSN: 1945-4589
Research Paper
|
Volume 15, Issue 21
|
pp. 12225–12250
Plumbagin has an inhibitory effect on the growth of TSCC PDX model and it enhances the anticancer efficacy of cisplatin
Back to article
Figure 1
(1 of 13)
−
100%
+
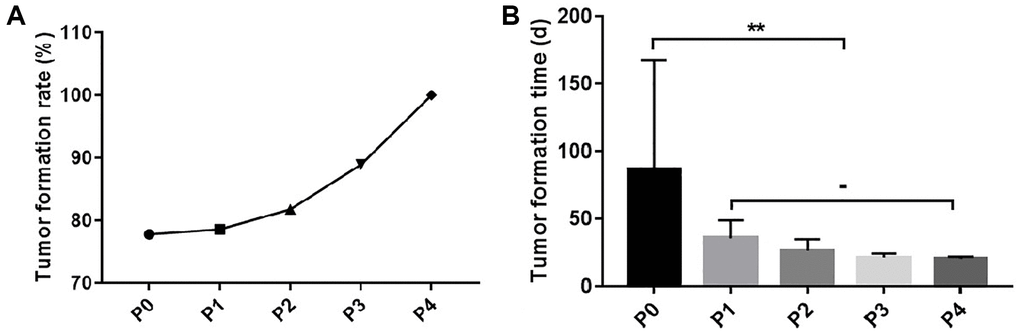
Figure 1.
Tumor formation rate and time of TSCC PDX model.
(
A
) The tumor formation rate of the P1-P4 generation PDX models. (
B
) The tumor formation time of the P1-P4 generation PDX models.
**
p
< 0.01; −, no statistical difference.