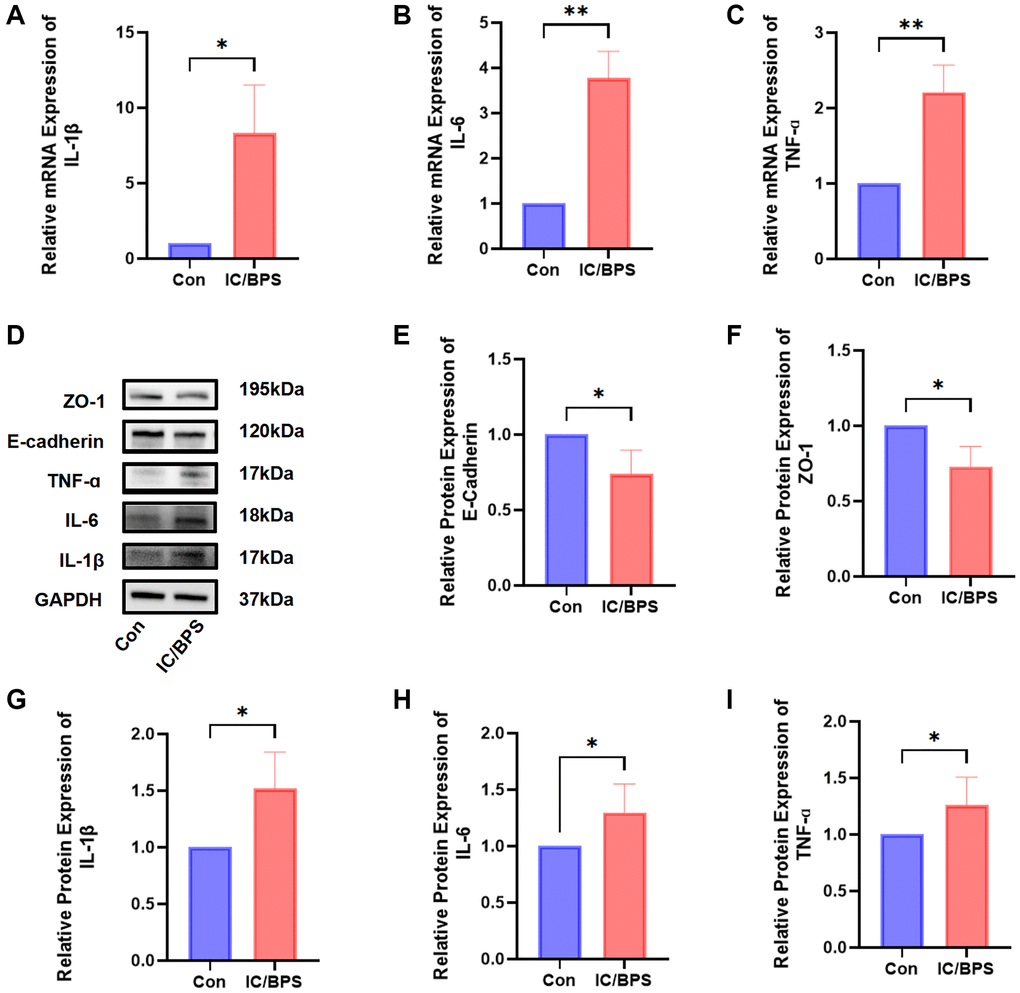
Figure 5.The construction of an IC/BPS model. (A–C) The qPCR showed that the expression levels of IL-1β, IL-6, and TNF-α were significantly higher in the lipopolysaccharide-induced IC/BPS model compared to Con. (D) Western blot analysis of ZO-1, E-cadherin, IL-1β, IL-6, TNF-α. (E–I) Relative protein expression of E-cadherin, ZO-1, IL-1β, IL-6, TNF-α. Results were presented as mean ± SD. *P < 0.05, **P < 0.01. All of the experiments were performed in triplicate.