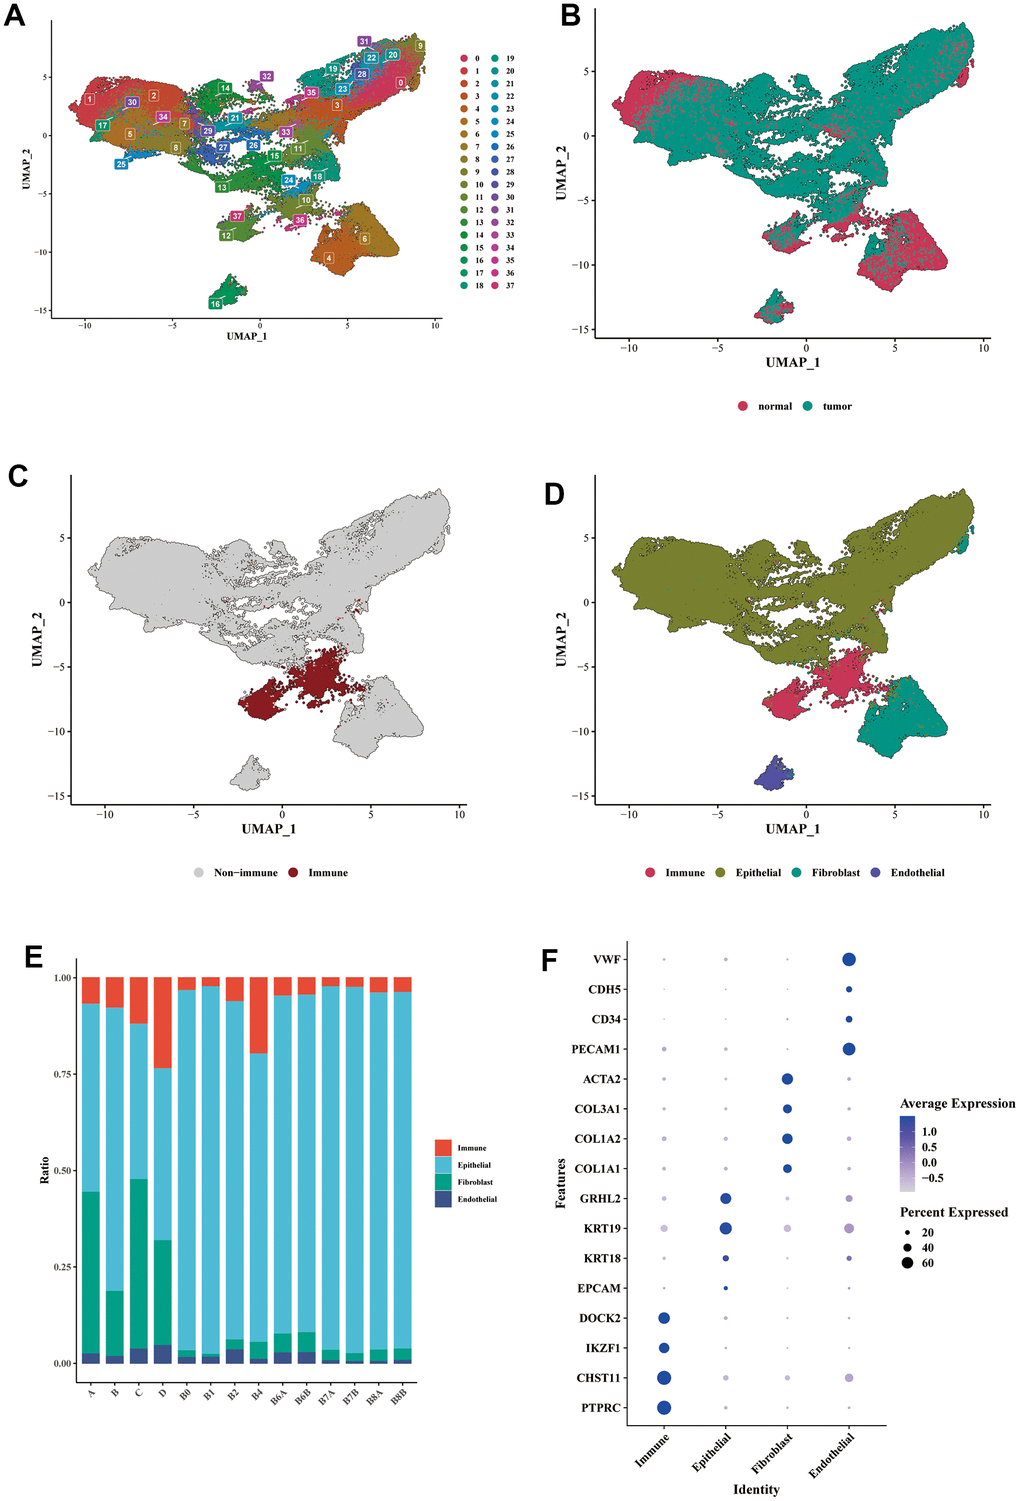
Figure 2.Single-cell expression profile of BLCA. (A) Dimensionality reduction clustering analysis of the whole cell in the BLCA samples. A total of 38 clusters were separated by different colors. (B) UMAP dimensionality reduction diagram showed the distribution of cells from tumor samples and normal samples. (C) Annotation of the immune cells cluster using the specific marker of PTPRC (CD45). (D) Annotations of epithelial cells, fibroblasts, and endothelial cells were shown in the form of UMAP diagram. (E) The proportion of each main cell type in different samples. (F) The bubble diagram showed the marker expression of each cell type. Epithelial cell markers: EPCAM, KRT18, KRT19, GRHL2; fibroblast markers: COL1A1, COL1A2, COL3A1, ACTA2; endothelial cell markers: PECAM1, CD34, CDH5, VWF.