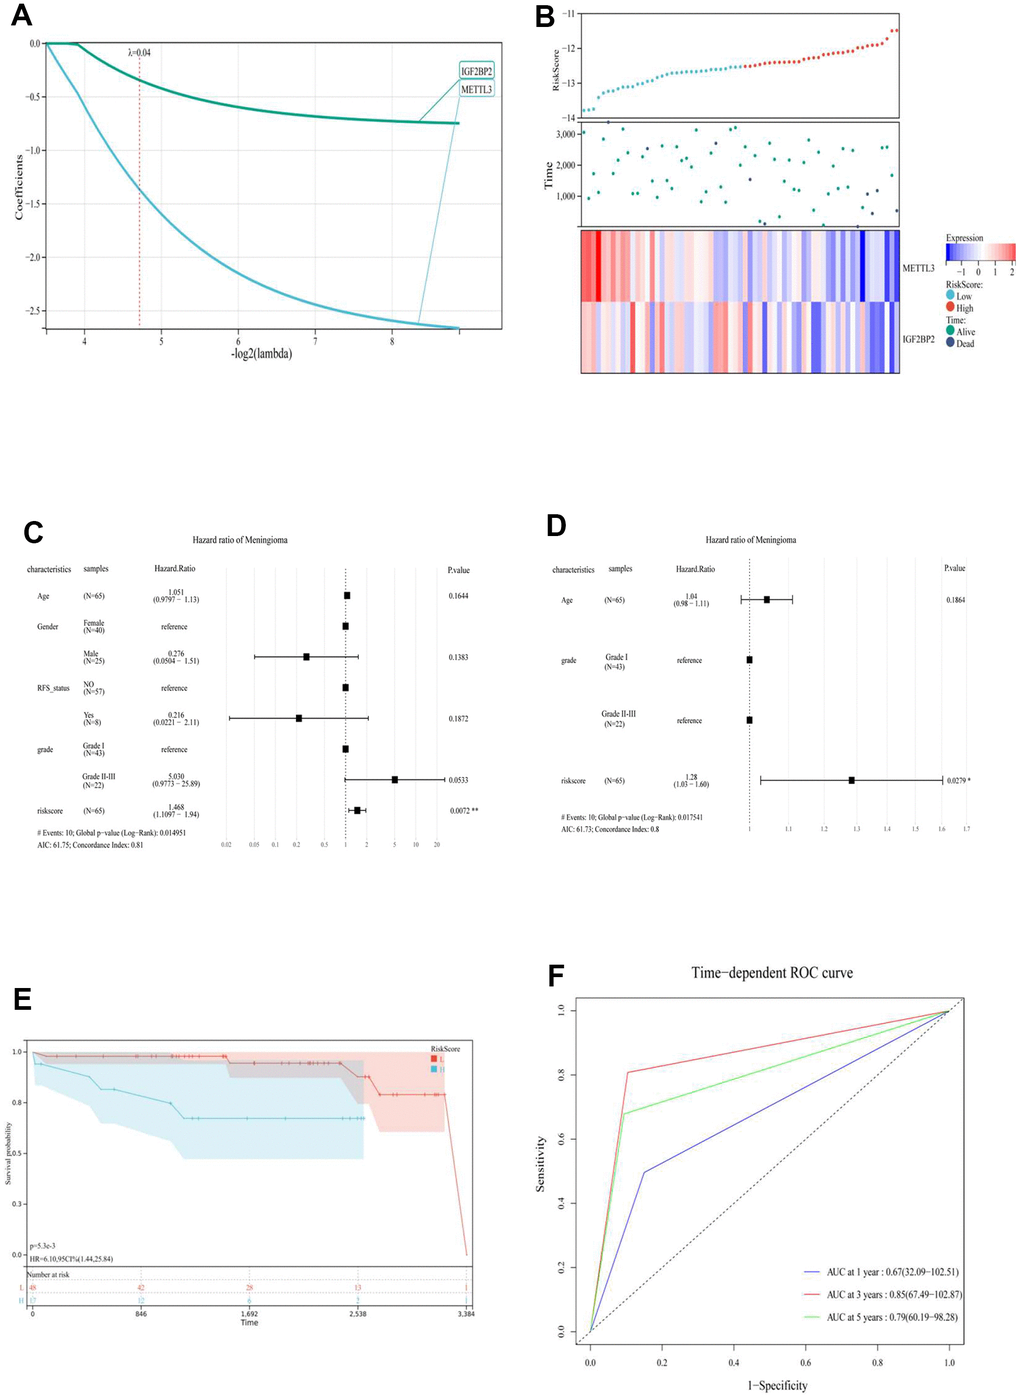
Figure 2.(A) LASSO Regression was applied to constructed prognostic prediction model of the m6A regulator. (B) RiskScore, survival time and status of each patient (GSE16581), and the expression of two m6A regulatory genes (IGFBP2 and METTL3). (top) RiskScore of each meningioma patient. Blue represents low risk and red represents high risk. (Middle) The survival time and status of each patient with meningioma. (Bottom) The heat map showed the expression of two m6A regulatory genes (IGFBP2 and METTL3) in each patient with meningioma. Blue to red indicated the expression of m6A regulatory genes from low to high expression. Univariate (C) and multivariate (D) Cox regression analysis to develop the risk scores in meningioma. (E) Kaplan-Meier curve analysis of high-risk group and low risk group. (F) ROC curve showing the supporting the performance of prognostic prediction model. ROC, receiver operating characteristic; L, low risk score group. H, high risk score group.