Submit an Article
Navigate
Home
Editorial Board
Editorial Policies
Current Volume
Archive
Scientific Integrity
Publication Ethics Statements
Interviews with Outstanding Authors
Newsroom
Sponsored Conferences
Podcast
Contact
Special Collections
Submit an Article
Online ISSN: 1945-4589
Research Paper
|
Volume 15, Issue 21
|
pp. 11994–12020
Hepatoprotective effect of syringin combined with costunolide against LPS-induced acute liver injury in L-02 cells via Rac1/AKT/NF-κB signaling pathway
Back to article
Figure 2
(2 of 11)
−
100%
+
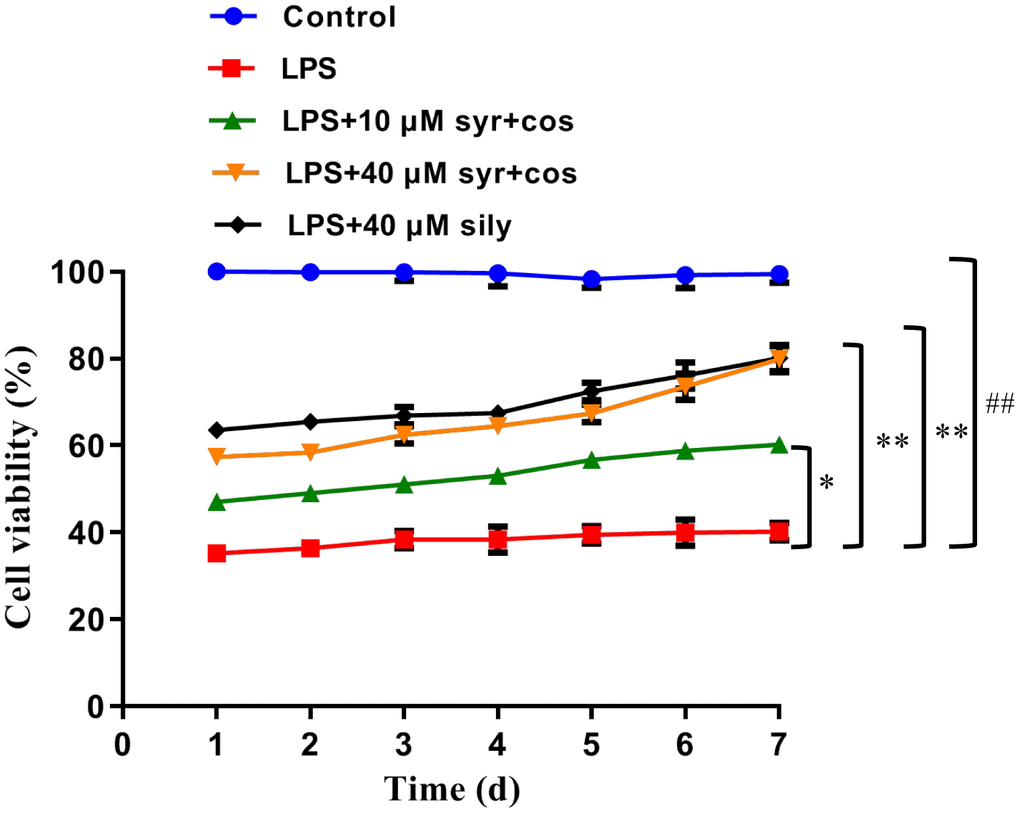
Figure 2.
Effects of syr+cos on the cell viability of L-02 cells.
Note: The data represent the mean ± SD per group.
**
P
< 0.01 or
*
P
< 0.05 vs control group;
##
P
< 0.01 vs LPS treatment group.