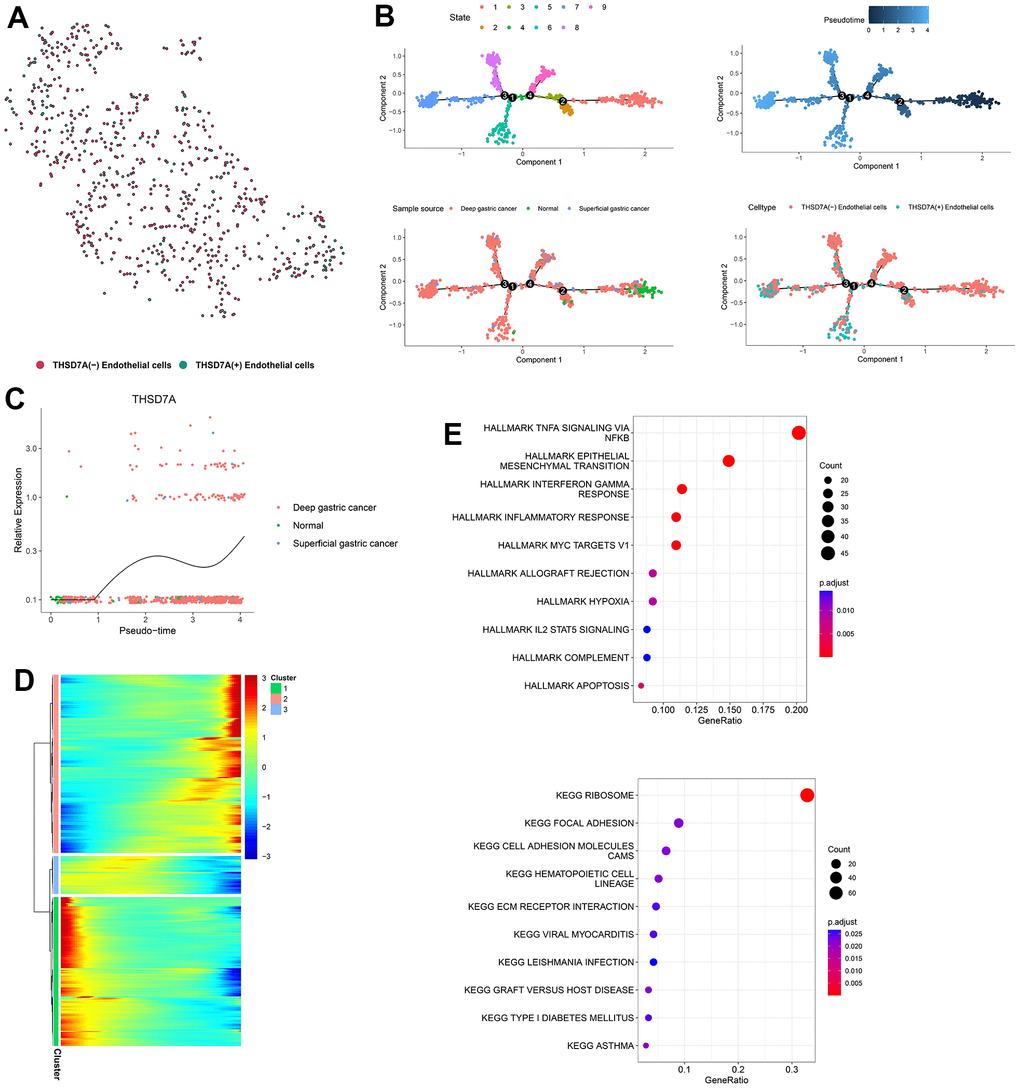
Figure 9.Pseudotime analysis of endothelial cell subpopulations. (A) Endothelial cells are classified into two subpopulations, namely THSD7A (+) and THSD7A (-). (B) Pseudotime trajectory of endothelial cells. (C) Change in THSD7A expression with pseudotime trajectory in different types of tissues. (D) Dynamic expression of genes in the pseudotime trajectory; red represents upregulated gene expression; blue represents downregulated gene expression. (E) Enrichment analysis of gene cluster 2.