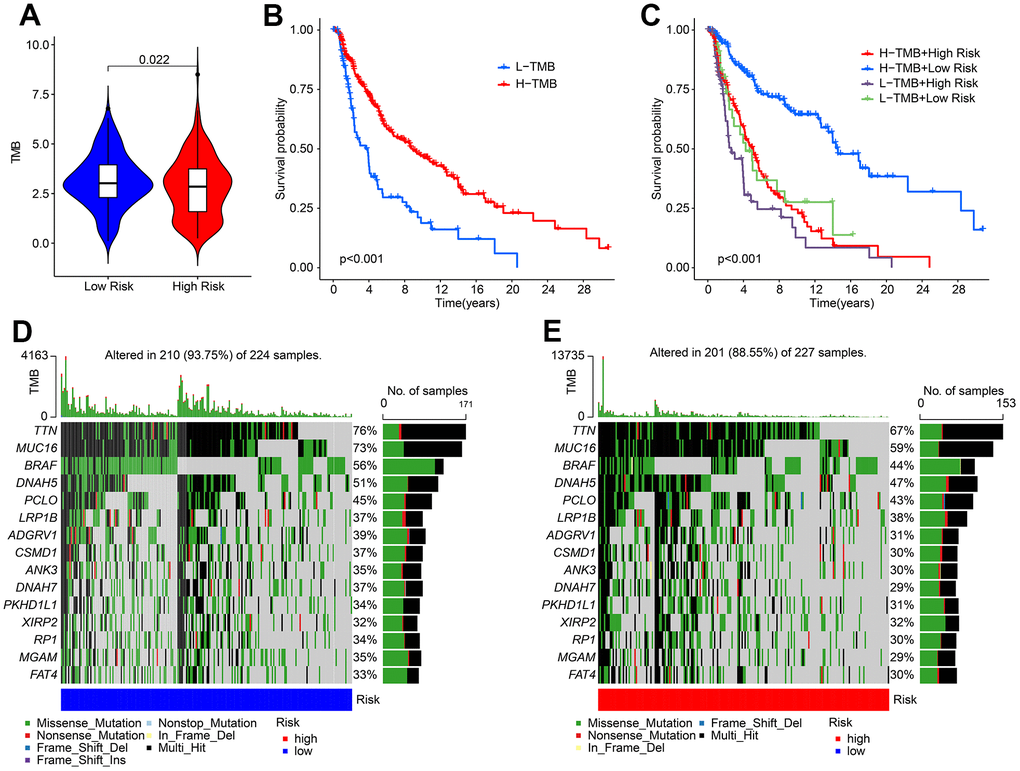
Figure 9.The tumor mutational burden landscape of patient in the low- and high-risk group. (A) TMB analysis in the low- and high-risk group. (B) The Kaplan-Meier survival curve analysis of patients with low- and high-TMB. (C) Kaplan-Meier survival curve of patient with L-TMB and H-TMB in the low- and high-risk group. (D, E) The mutant landscape of CM patients in the low- and high-risk group.