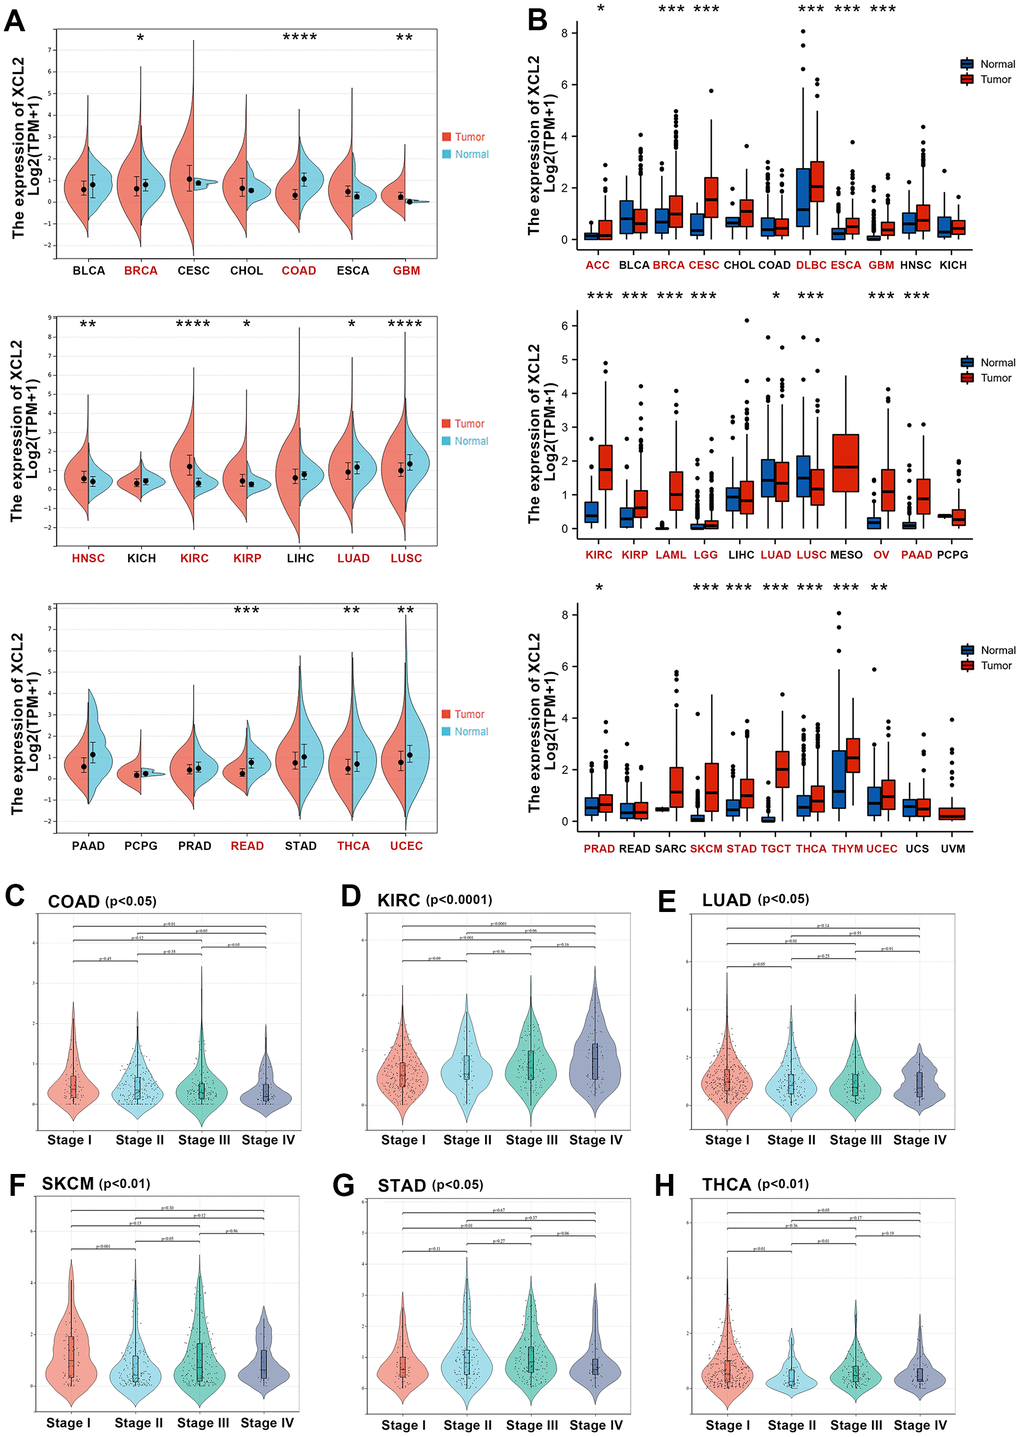
Figure 1.The expression levels of XCL2 mRNA in pan-cancer. (A) The mRNA expression levels of XCL2 in 21 types of tumors tissues and adjacent normal tissues from the TCGA database; (B) Expression of XCL2 between the 33 cancers and normal tissues in unpaired sample analysis; (C–H) The correlation between the XCL2 expression and cancer stages in COAD, KIRC, LUAD, SKCM, STAD, and THCA (*P < 0.05, **P < 0.01, ***P < 0.001).