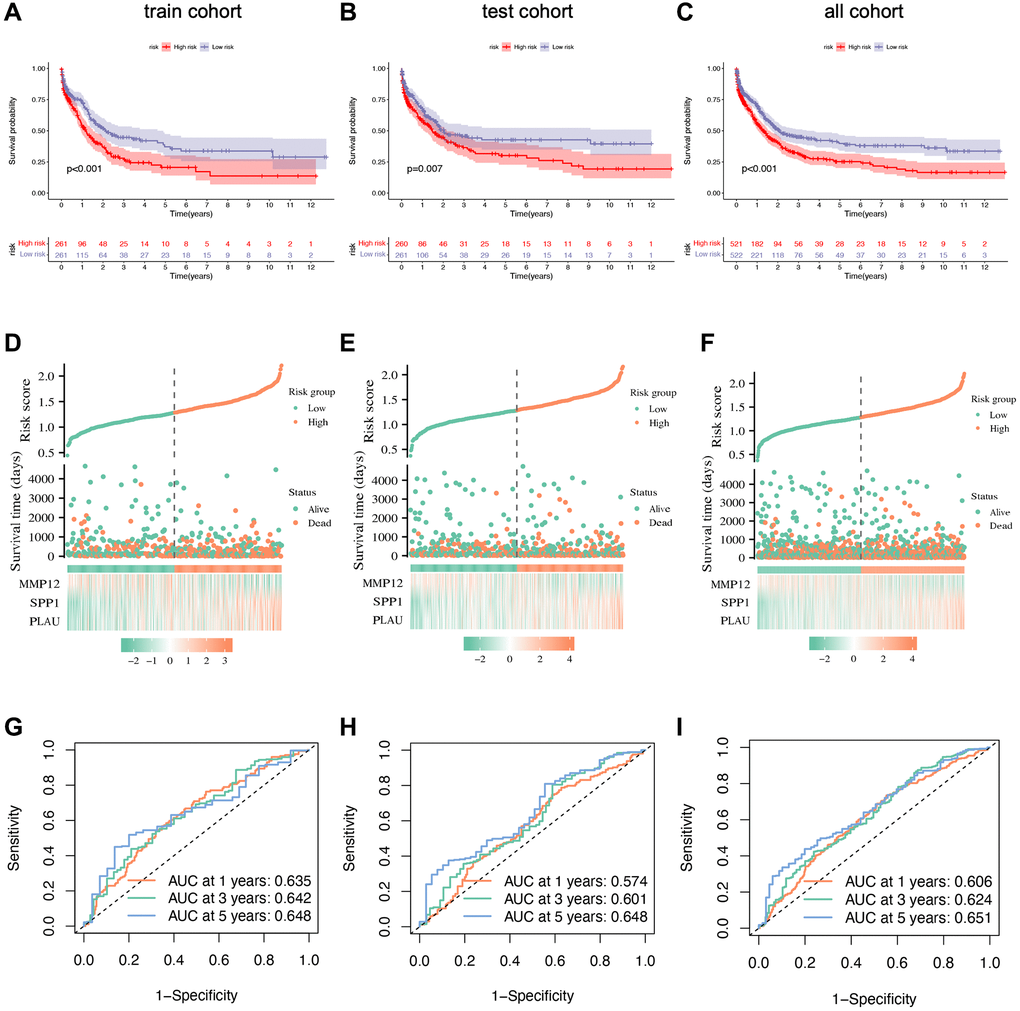
Figure 6.Prognostic validation of risk signature. (A–C) Kaplan–Meier survival analysis with p-value < 0.05 indicating that the established risk signature can identify high- and low-risk groups. (D–F) Scatter plots showing the relationship between risk score and survival time. (G–I) ROC curve to predict the accuracy of the patient's one-year, three-year, and five-year survival rate.