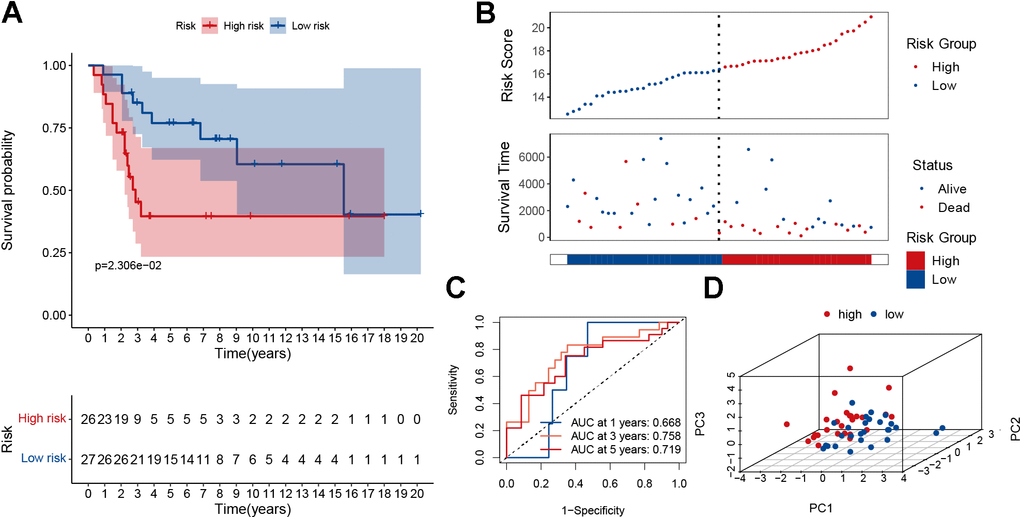
Figure 5.Validation of the MRGs signature in the GSE21257 dataset. (A) Kaplan–Meier survival curve analysis of patients in the high-risk group and low-risk group. (B) The distributions of survival status and risk score. (C) The AUC of time-dependent ROC curves. (D) PCA plot based on the MRGs signature.