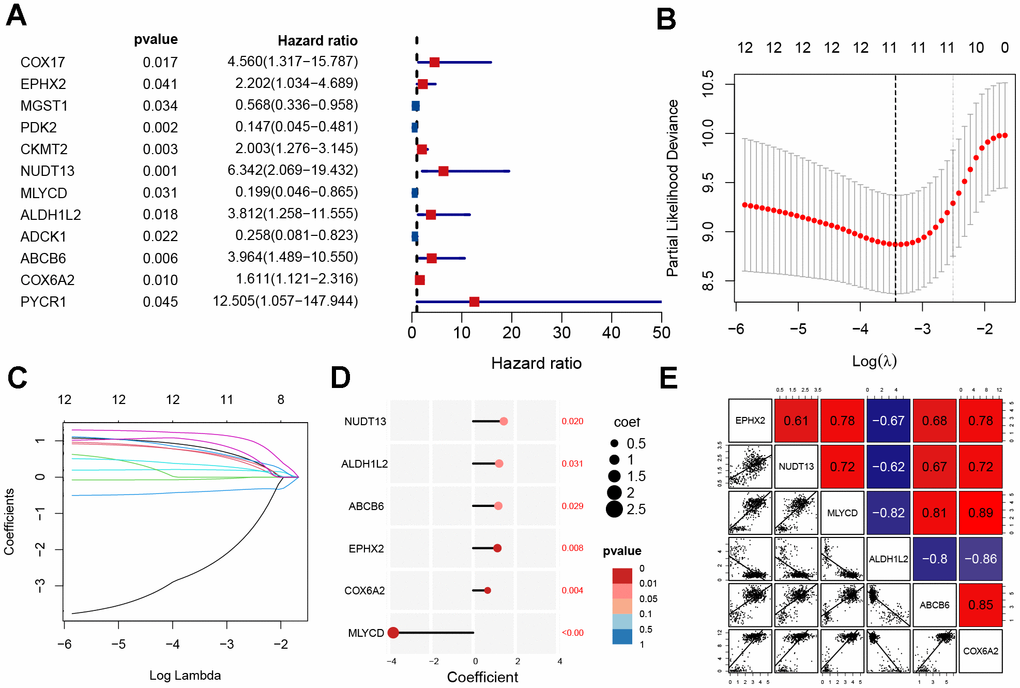
Figure 3.Construction of mitochondrial-related gene signature. (A) Univariate analysis of potential prognostic factors. (B, C) Lasso regression for MRGs in univariate Cox regression. (D) The coefficients and P-value of the six MRGs. (E) Correlation diagram of six gene expression levels.