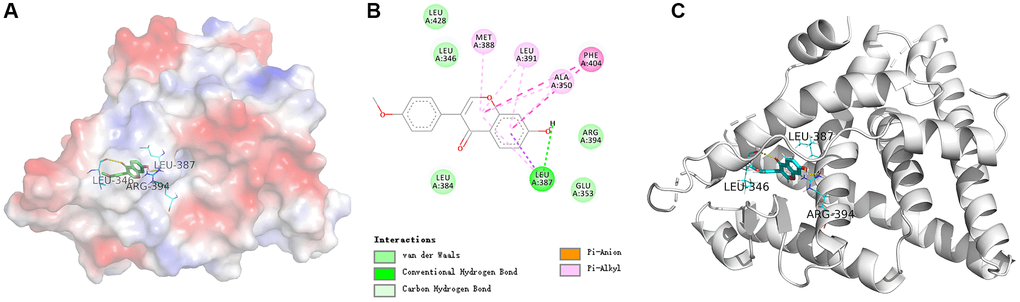
Figure 4.(A) The electrostatic potential energy diagram of ESR1 and formononetin ligand. (B) The 2D structural diagram showing the interaction between ESR1 and formononetin ligand. (C) The structural diagram illustrating the interaction between ESR1 and formononetin ligand.