Submit an Article
Navigate
Home
Editorial Board
Editorial Policies
Current Volume
Archive
Scientific Integrity
Publication Ethics Statements
Interviews with Outstanding Authors
Newsroom
Sponsored Conferences
Podcast
Contact
Special Collections
Submit an Article
Online ISSN: 1945-4589
Research Paper
|
Volume 15, Issue 20
|
pp. 11489–11507
Anti-cancer targets and molecular mechanisms of formononetin in treating osteosarcoma based on network pharmacology
Back to article
Figure 3
(3 of 12)
−
100%
+
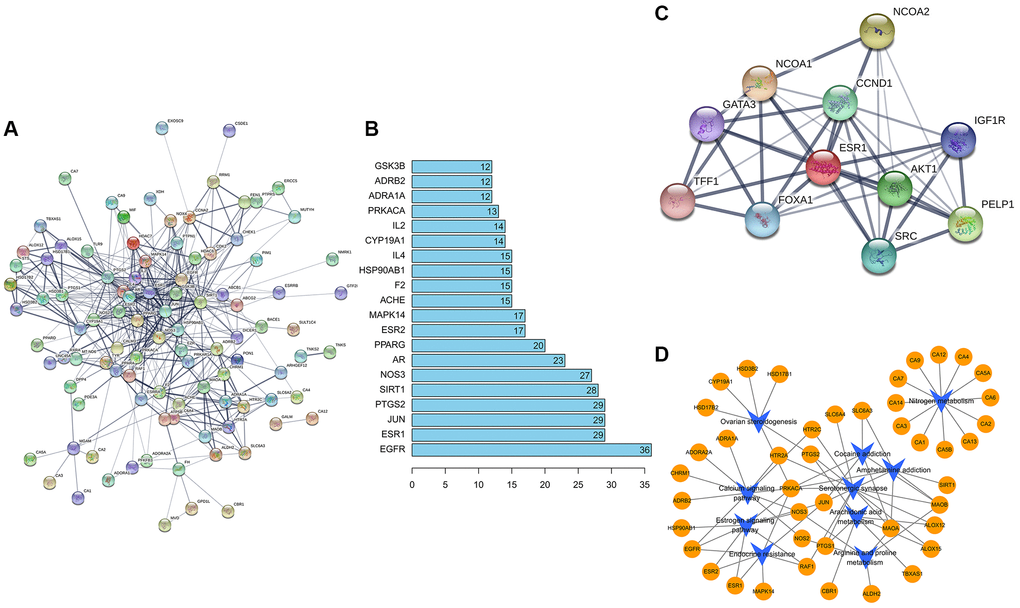
Figure 3.
(
A
) Construction of formononetin network. (
B
) The abscissa represents the number of related pairs of genes in the network diagram. (
C
) The ESR1 protein interaction diagram. (
D
) The formononetin targets gene network.