Submit an Article
Navigate
Home
Editorial Board
Editorial Policies
Current Volume
Archive
Scientific Integrity
Publication Ethics Statements
Interviews with Outstanding Authors
Newsroom
Sponsored Conferences
Podcast
Contact
Special Collections
Submit an Article
Online ISSN: 1945-4589
Research Paper
|
Volume 15, Issue 21
|
pp. 11831–11844
RAI2 acts as a tumor suppressor with functional significance in gastric cancer
Back to article
Figure 6
(6 of 8)
−
100%
+
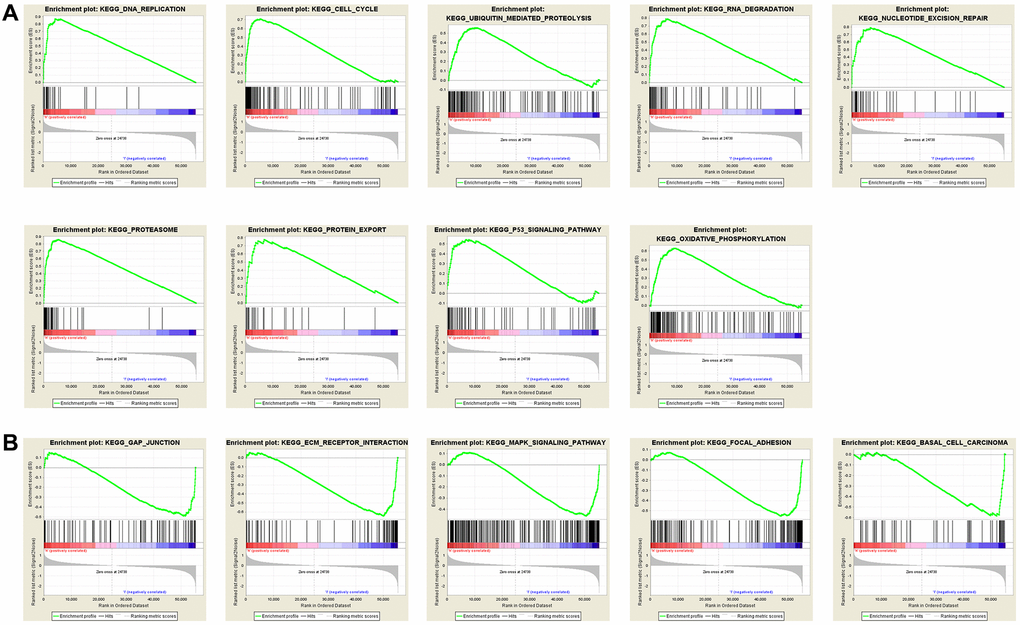
Figure 6.
Annotation of KEGG pathway among the top 30 samples with the highest and lowest RAI2 expression via multiple GSEA analysis.
(
A
) Pathways positively correlated with RAI2 expression. (
B
) Pathways negatively correlated with RAI2 expression.