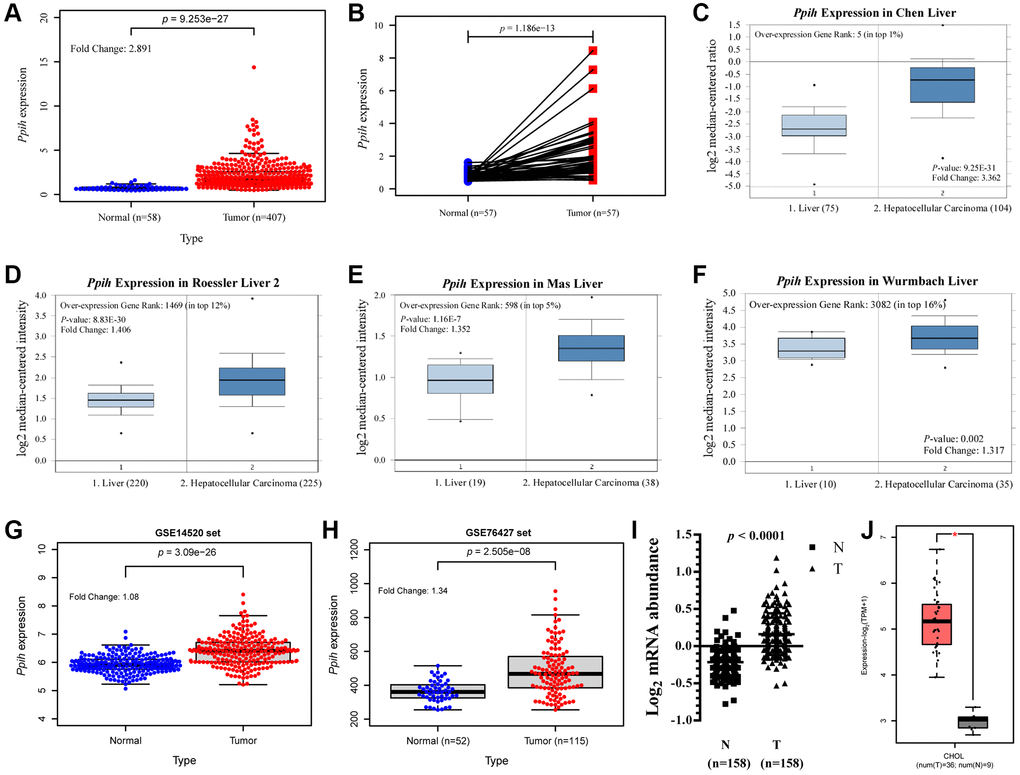
Figure 2.Ppih mRNA expression is significantly upregulated in Hepatocellular carcinoma (HCC) compared with normal tissues. (A) Expression of Ppih in HCC tissues (TCGA) and healthy liver tissues (TCGA) by RNA-Seq. (B) Paired expression data of Ppih mRNA in HCC and adjacent normal tissues by RNA-Seq in TCGA dataset. (C–F) Boxplot showing Ppih mRNA expression in liver (left plot) and HCC tissue (right plot) was derived from the Oncomine database. The fold-change in Ppih expression in HCC was determined using the Oncomine database. The data are HCC relative to normal liver tissue. The threshold was designated using the following specific parameters: p value = 1E-4, fold change = 2, and gene rank 10%. (G, H) Validation of the expression level of Ppih in HCC and normal tissues. GSE14520 and GSE76427 were regarded as the validation set. (I) Expression levels of Ppih mRNA in HBV-related HCC and paired nontumor liver tissues were investigated using RNA-seq (n = 158). These results were obtained from the studies of Gao et al. [17]. (J) mRNA expression of Ppih in cholangiocarcinoma (CHOL) tissues and adjacent normal tissues from the GEPIA 2 database. *p < 0.05.