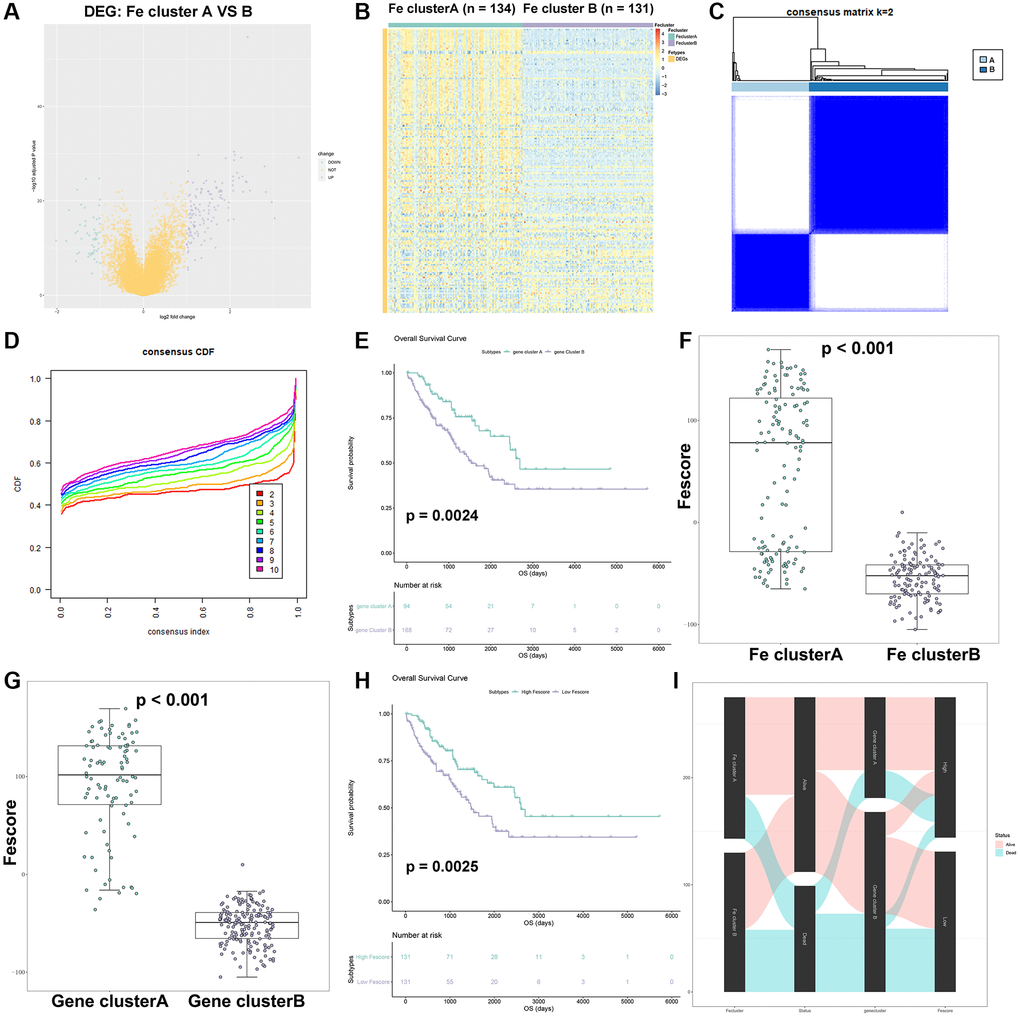
Figure 7.Construction of Fescore. (A) Volcano plot of DEGs between Fe cluster A and B. (B) The heatmap of expression of DEGs in Fe cluster A and B. (C) The result of consensus clustering analysis in STS based on 143 DEGs; The relationship between DEGs and these prognostic genes visualized as a Sankey diagram. (D) The cumulative distribution function plot in TCGA-SARC based on 143 DEGs. (E) Survival plot of gene clusters A and B in TCGA-SARC (p = 0.0024). (F) Comparison of Fescore among Fe clusters A and B. (G) Comparison of Fescore among gene clusters A and B. (H) Survival plot of high and low Fescore in TCGA-SARC (p = 0.0025). (I) The relationship between Fe clusters, gene clusters survival status and Fescore visualized as a Sankey diagram.