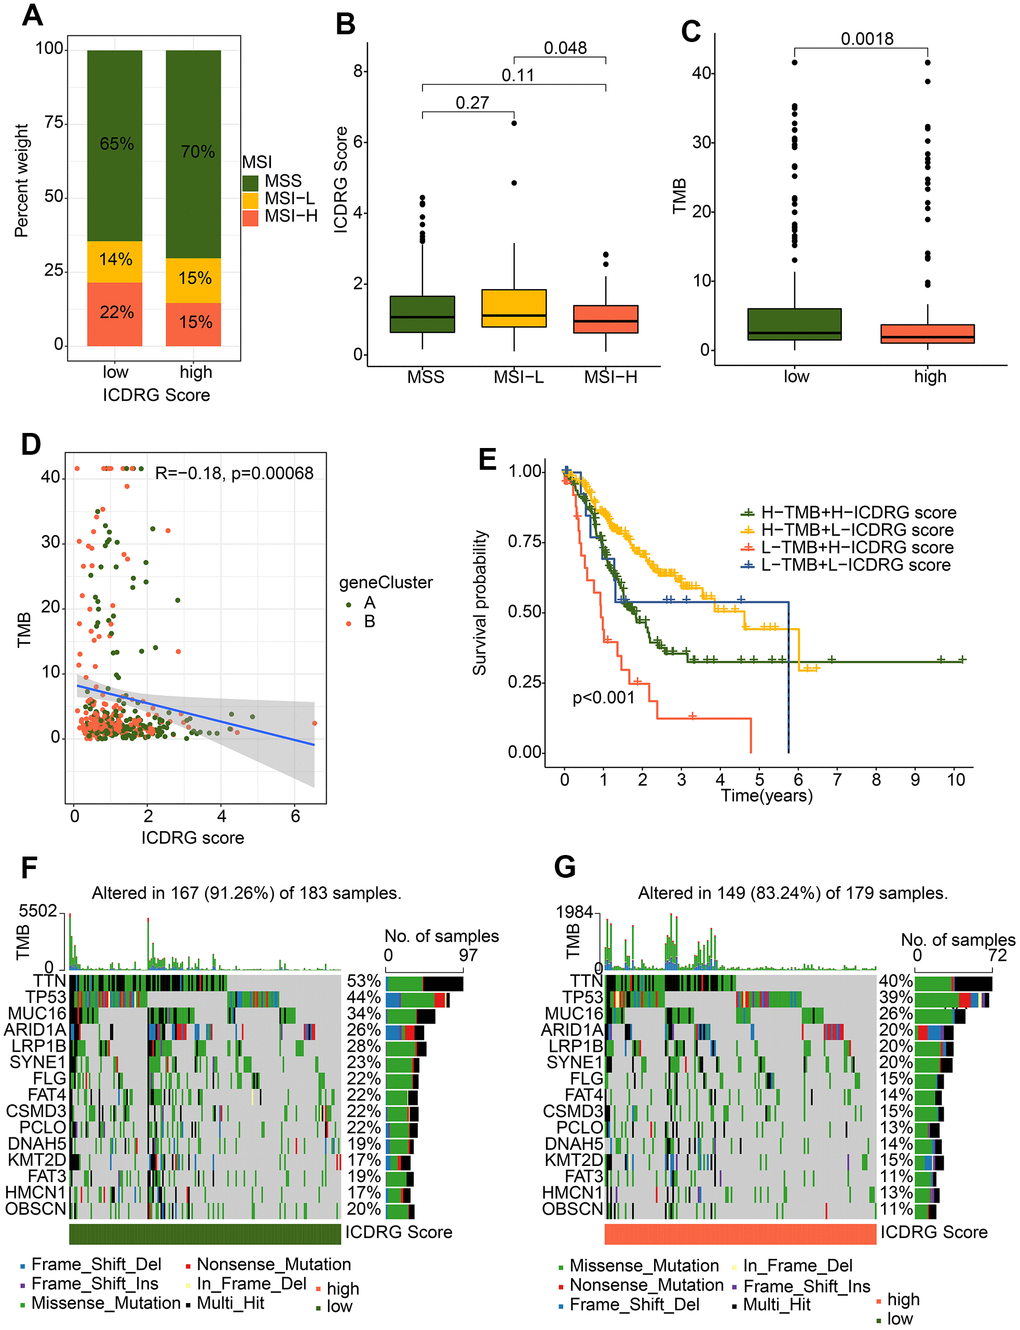
Figure 10.Somatic mutation landscape and MSI in GC. (A) Percent of MSI in low- and high-risk groups. (B) Distribution of risk score in MSS, MSI-L, and MSI-H. (C) TMB analysis. (D) Correlation analysis of TMB and ICDRG score. (E) Kaplan–Meier plotter for GC patients stratified ICDRG score and TMB. (F, G) The top 15 most frequently mutated genes in low- and high-risk groups.