Submit an Article
Navigate
Home
Editorial Board
Editorial Policies
Current Volume
Archive
Scientific Integrity
Publication Ethics Statements
Interviews with Outstanding Authors
Newsroom
Sponsored Conferences
Podcast
Contact
Special Collections
Submit an Article
Online ISSN: 1945-4589
Research Paper
|
Volume 15, Issue 20
|
pp. 11369–11388
Comprehensive analysis of integrin αvβ3/α6β1 in prognosis and immune escape of prostate cancer
Back to article
Figure 6
(6 of 7)
−
100%
+
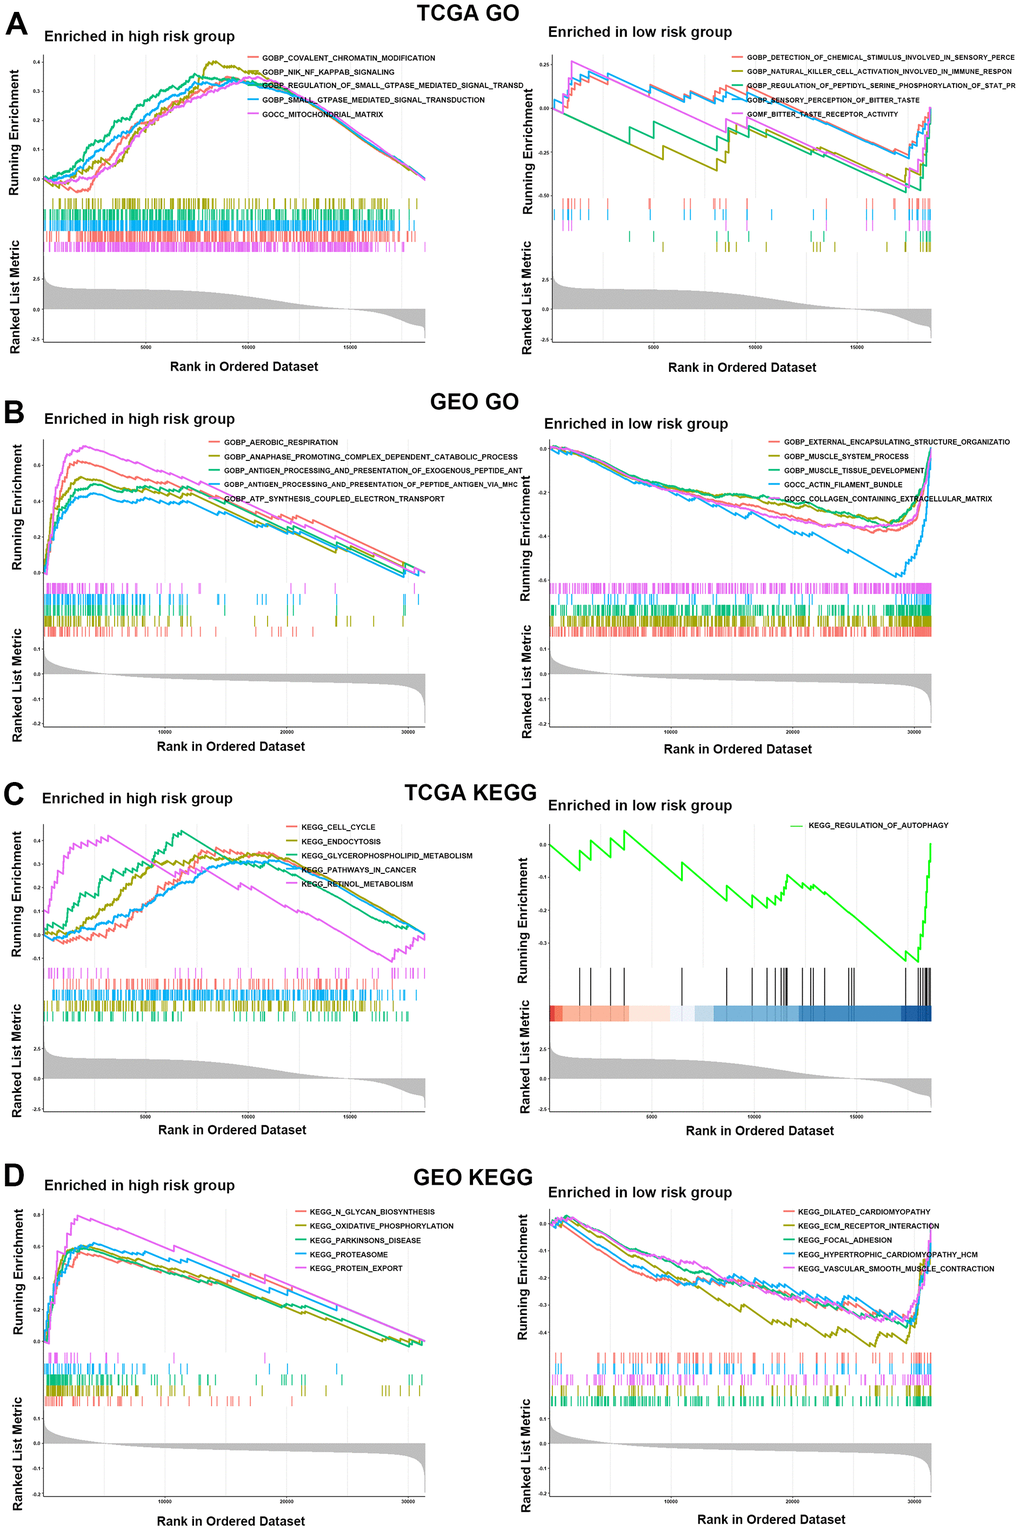
Figure 6.
Functional enrichment analysis for the two risk groups.
(
A
,
B
) GO enrichment analysis for two risk groups in the TCGA (
A
) and GEO (
B
) cohorts. (
C
,
D
) KEGG enrichment analysis in the HR and LR groups in the TCGA (
C
) and GEO (
D
) cohorts.