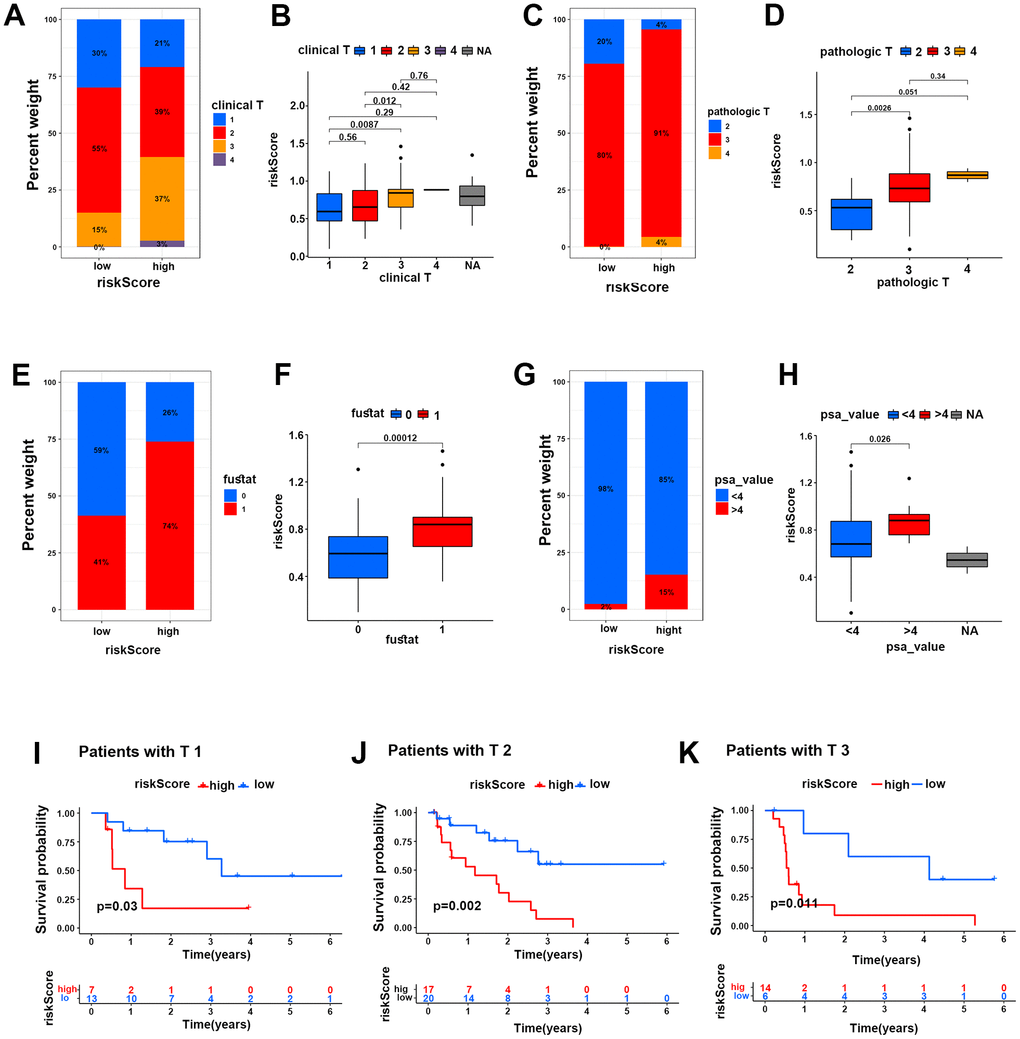
Figure 5.The HR risk group predicted poor clinical characteristics of PCa patients. (A–H) Percent weights and risk scores of clinical T grades (A, B), pathological T grades (C, D), fustat (E, F) and PSA values (G, H) of the two risk groups in the TCGA cohort. (I–K) Kaplan-Meier survival analysis for PCa patients with clinical T1, T2 and T3 grades in two risk groups in the TCGA cohort.