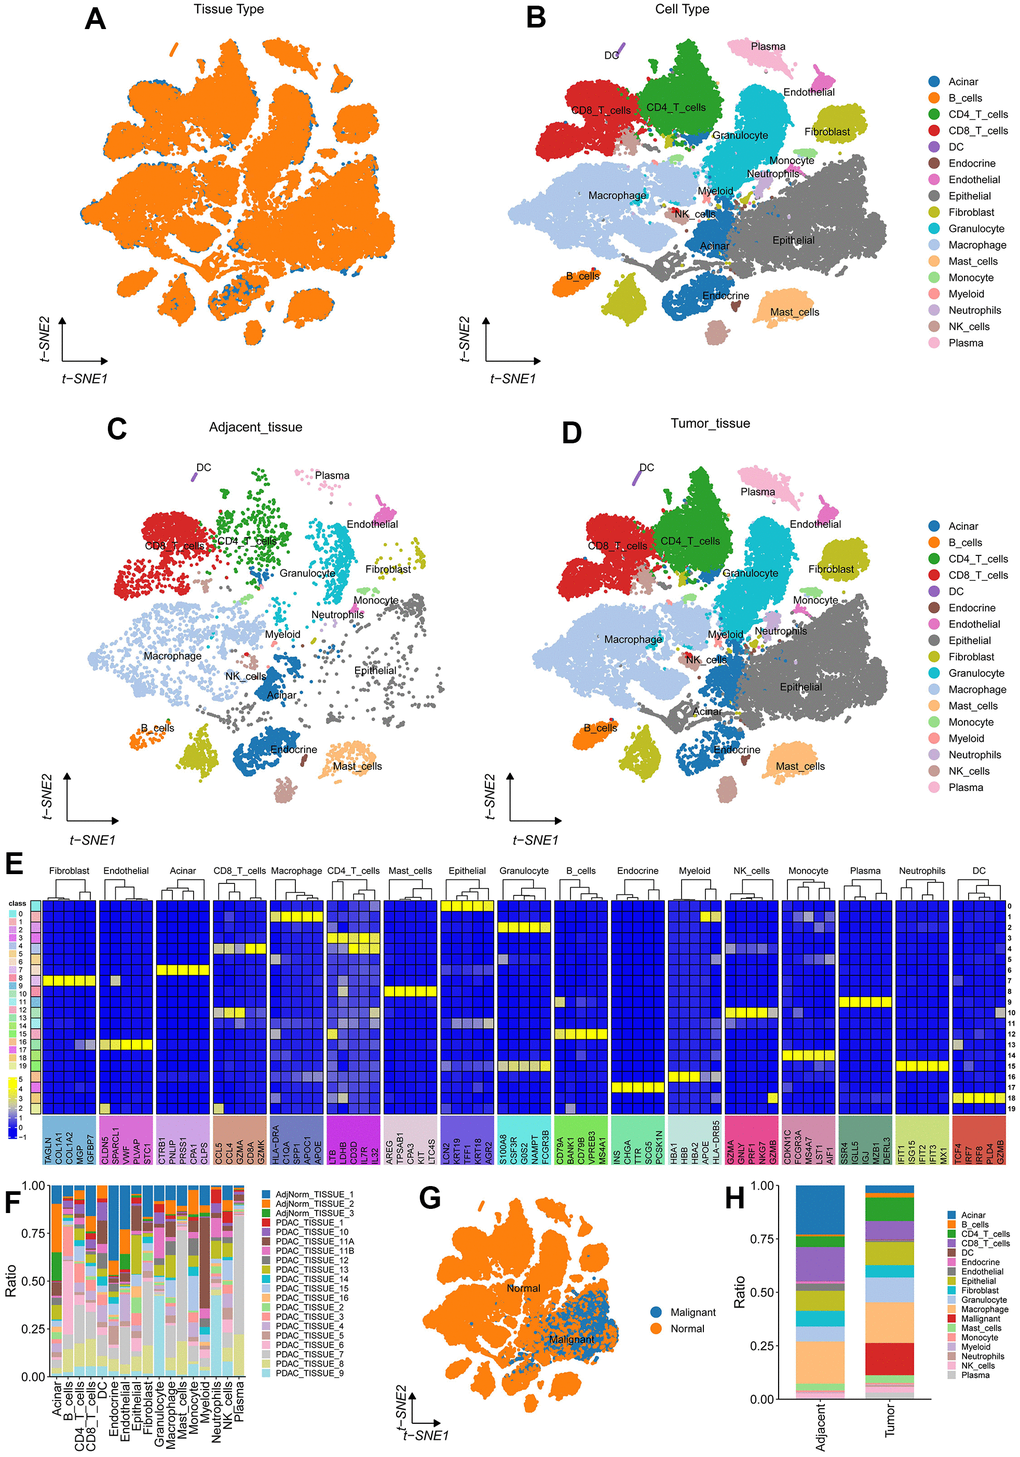
Figure 9.Pancreatic cancer single cell dimension reduction annotation. (A, B) tSNE on Tumor(yellow)/Adjacent(blue) and all patient tissues. (C, D) tSNE on 3 adjacent/normal pancreas (left) and 16 PDA patient (right) tissues. (E) Top 5 marker basis for each cell type; (F) Cell count statistics for each sample; (G) Copykat prediction results; (H) The proportion of various cell types adjacent to the tumor.