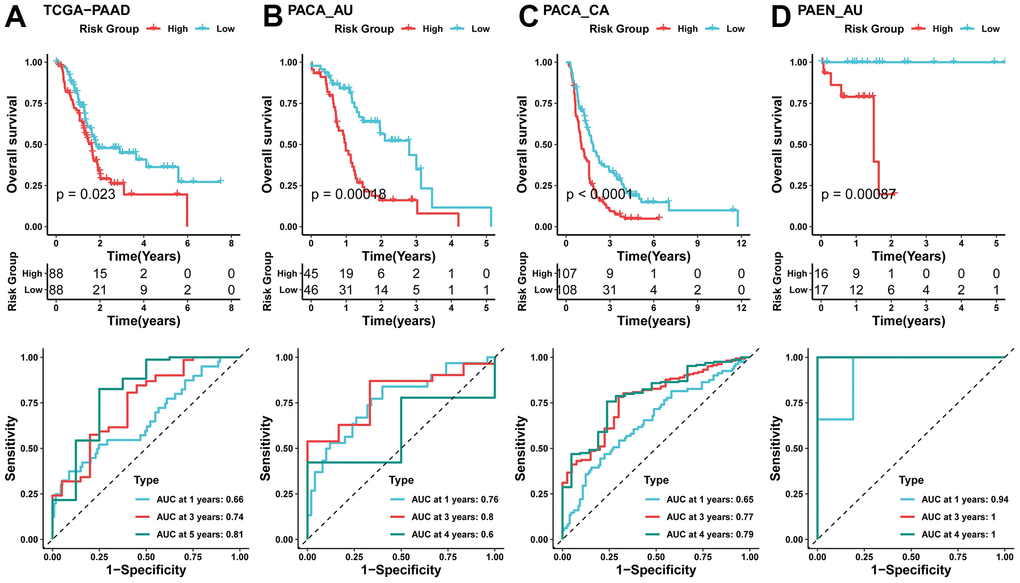
Figure 5.Validation of risk models using external data sets. (A) KM curve (top) of TCGA-PAAD dataset, Time-dependent area under the receiver operating characteristic curve (AUC) at 1-, 3-, and 5-year in the A TCGA-PAAD (bottom); (B–D) KM curve (top), Time-dependent area under the receiver operating characteristic curve (AUC) at 1-, 3-, and 4-year in the B PACA_AU, C PACA_CA, D PAEN_AU (bottom).