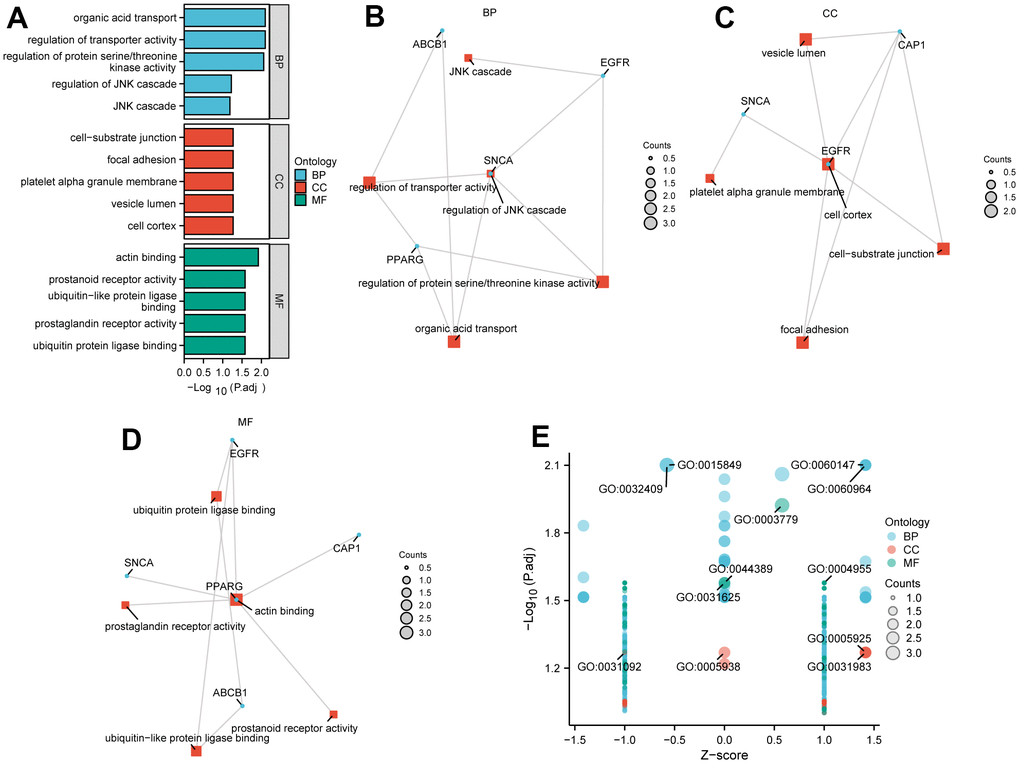
Figure 11.GO enrichment analysis. (A)The GO enrichment analyses of DEGs in Hub genes. (B–D) Chordal graph of GO enrichment for 5 Hub genes: BP pathway (B), CC pathway (C), and MF pathway (D). In the network diagram, blue dots represent specific genes, and red blocks represent specific pathways. (E) A bubble plot shows GO enrichment of a joint logFC. GO, Gene Ontology.