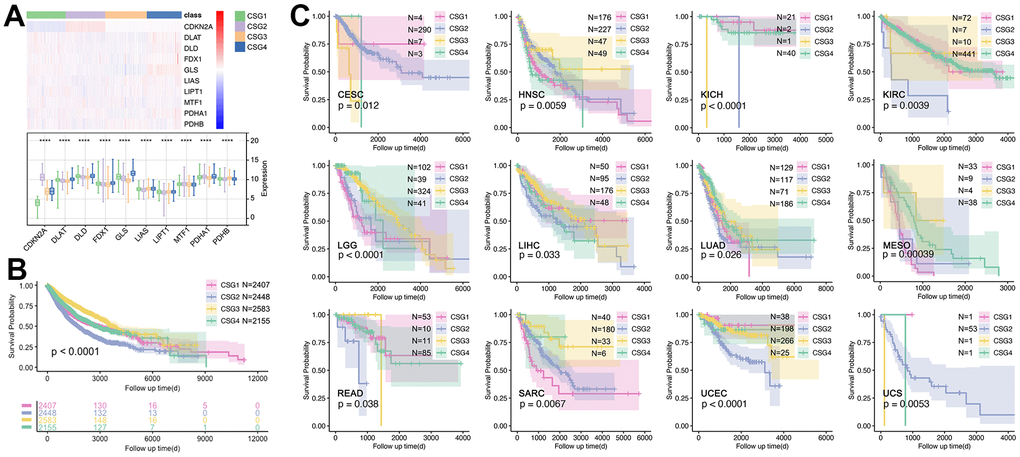
Figure 8.Expression profiles and prognosis features of CRG subgroups. (A) Expression profile of 10 CRGs in CRGs. (B) Prognosis differences of CRG subgroups. (C) CRG subgroup division identified the prognosis differences in single cancers, including CESC, HNSC, KICH, KIRC, LGG, LIHC, LUAD, MESO, READ, SARC, UCEC, and UCS.