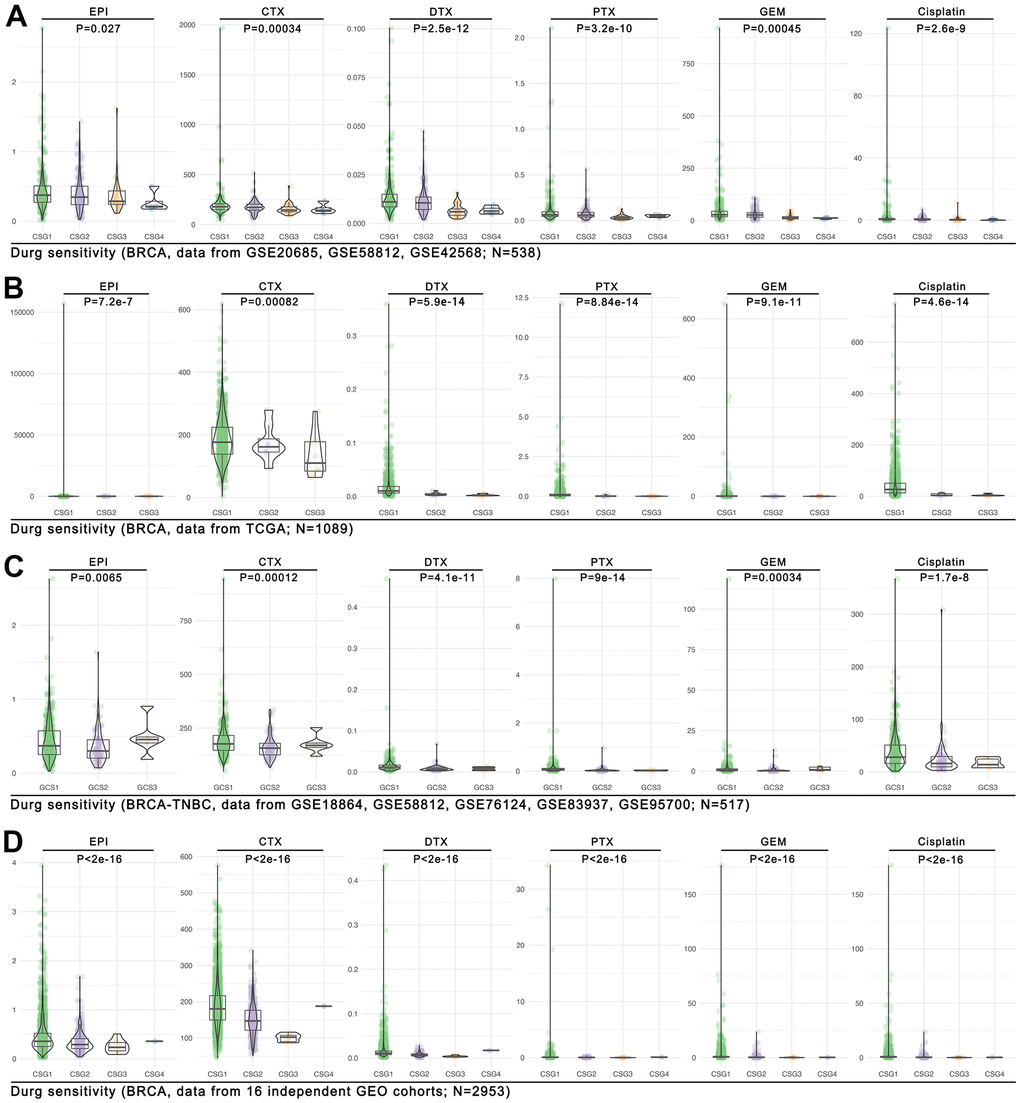
Figure 11.Drug sensitivity prediction in CRG subgroups. The OncoPredict function in R4.2.0 is performed to predict drug scores in four cohorts, and they are the (A) GEO breast cancer cohort (combined with GSE20685, GSE58812, GSE42568; n=538), (B) the TCGA breast cancer cohort (n=1089), (C) the GEO TNBC cohort (combined with GSE18864, GSE58812, GSE76124, GSE83937, GSE95700; n=517), and (D) the large GEO breast cancer cohort (combined with 16 independent cohorts; n=2953).