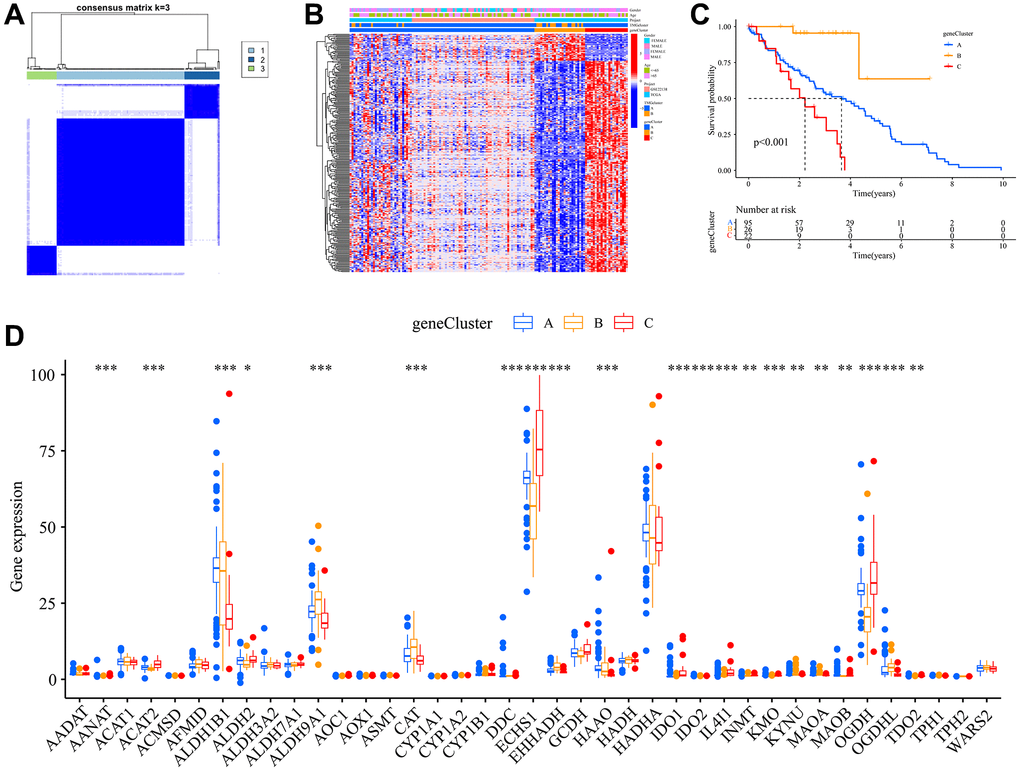
Figure 3.Construction of gene subtypes. (A) Harmonized matrix heatmap delineating a pair of distinct gene assemblages; (B) Disparate expression of TMRGs amid clinical characteristics within the duet of gene subclasses; (C) Survival curves for OS of the two gene subtypes; (D) Variations in the manifestation of 40 TMRGs between the pair of gene subclasses.