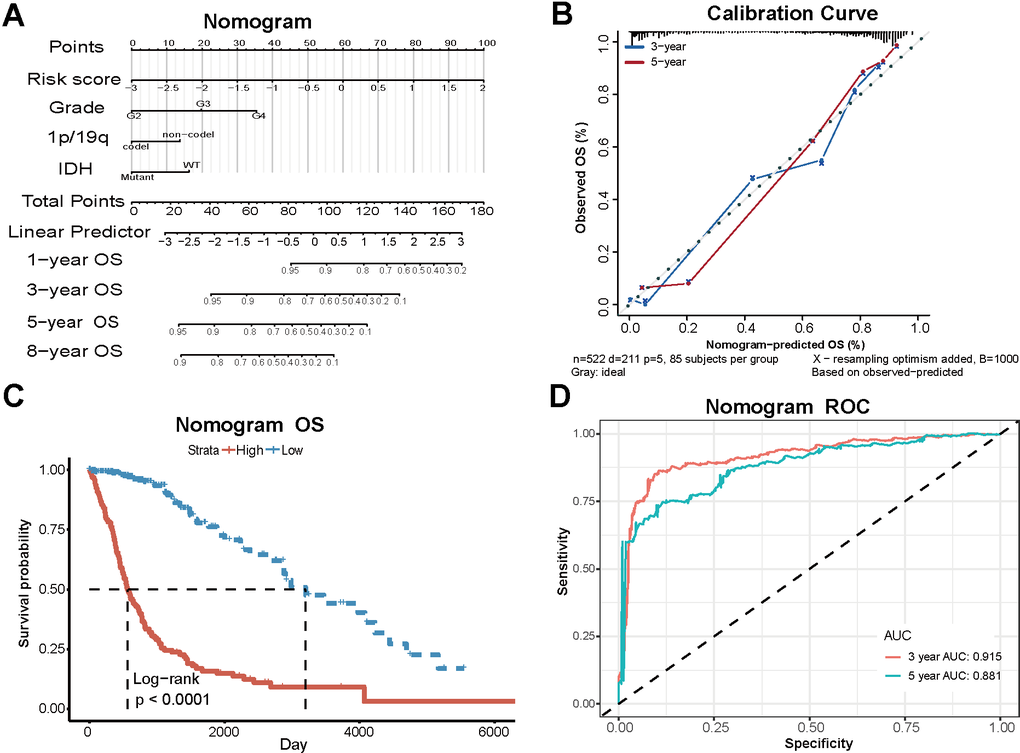
Figure 6.Clinical models based on PD-L1-related lncRNAs and clinical characteristics. (A) The nomogram combining risk scores and clinical case characteristics according to TCGA data. (B) The calibration curves showing the predicted and actual observed OS rates. (C) Survival analysis of new high-risk group and low-risk group. (D) The ROC curves and AUC values of the nomogram.