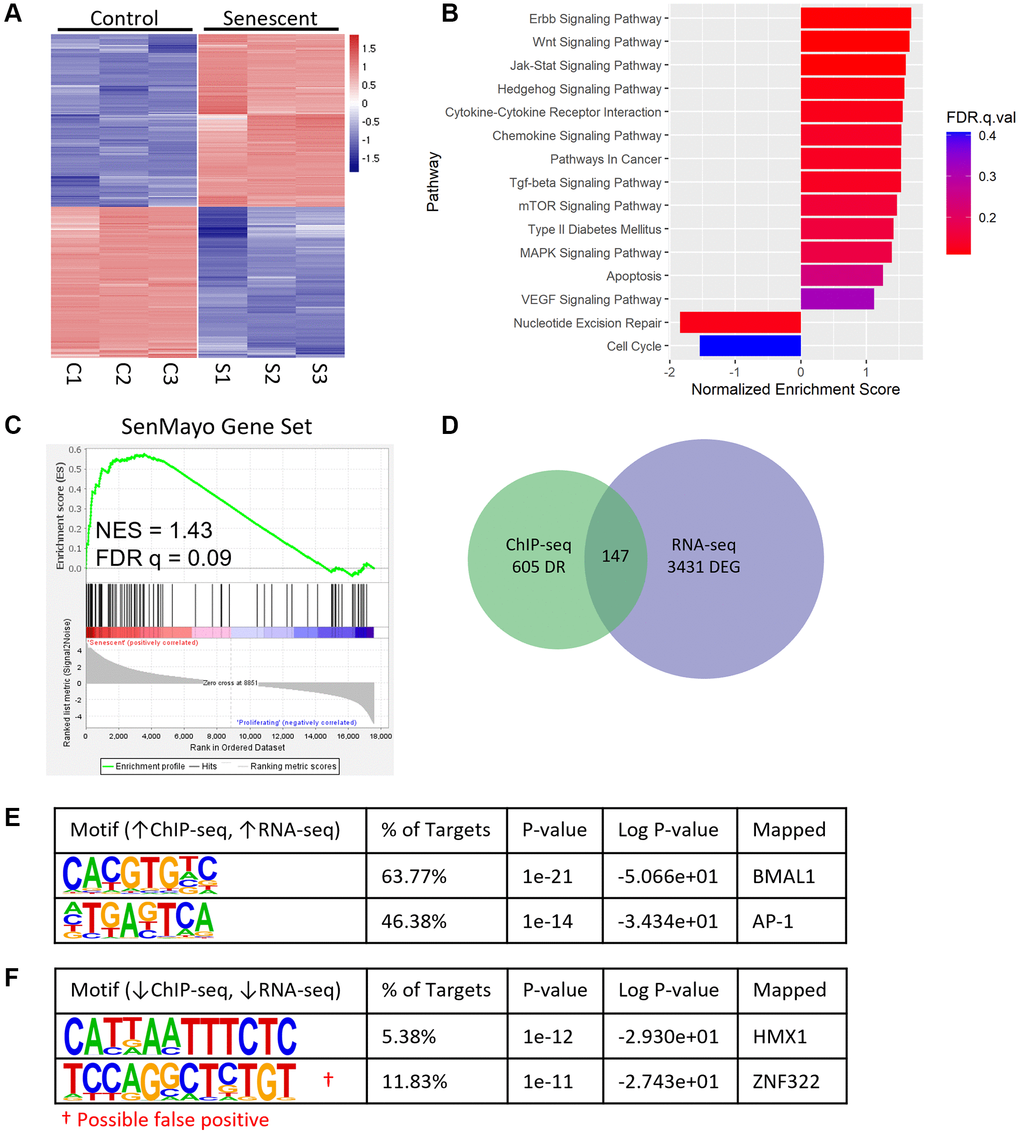
Figure 3.BMAL1 binding correlates with enriched gene expression in senescence. (A) Heatmap of DEGs from control and senescent RNA-seq. (B) Enriched pathways in senescent cells identified by KEGG, negative NES indicates pathways enriched in control cells. (C) GSEA enrichment plot of the SenMayo gene set in senescent cells. (D) Venn diagram of DEGs from RNA-seq and differentially bound regions from BMAL1-ChIP-seq. (E, F) Top motifs enriched in senescent cells with increased gene expression (E) and enriched in control cells with increased gene expression (F). n = 3 replicates for RNA-seq, n = 3 replicates for BMAL1-ChIP-seq. False positives are indicated with red†.